How to analyze the site and pages with SEOZoom tools
What does it mean to analyze a website? Behind this question that may seem trivial or obvious there is actually the daily work of those who work in the field of website analysis and juggle tools, methods, techniques and especially data that come from different sources: the angles to perform the meticulous study of the parts that make up the site, and even more the verification of the performance of individual pages, in fact requires time, patience and expertise, but with some tools and SEOZoom features we can simplify some steps and always have at “hand” the main indicators to optimize our strategies for organic visibility.
Website analysis, the definition
Website analysis is the practice of checking, testing and analyzing the performance of a site in relation to various aspects, from technical ones such as speed and absence of errors to those more related to SEO, to competition, traffic and user behavior.
The process of analyzing websites goes through examining and reviewing page performance for key metrics-as mentioned, speed, traffic, search engine optimization (SEO) and user experience, among others-that already individually represent a success factor for the project.
It is therefore a general and, in some ways, generic operation, because it serves to obtain the basic information about the state of a domain health, to be then deepened with more targeted investigations that can lead to the improvement of an area that is not working properly: for example, if we notice problems in loading pages it might be useful to reduce the size of images to increase the overall speed, while optimizing a content could bring positive effects in the rankings.
What is the point of analyzing the website
Conducting a Web site analysis is useful and important because it allows us to find data and information that can be used to improve pages and strategies to attract more visitors and, therefore, higher returns; analyzing a site also helps us identify which optimization interventions are successful, which ones do not bring the expected results, where updates and improvements might be needed, and so on.
In addition to focusing on our own site, then, it might prove to be a smart move to also perform an analysis of competitor websites, which can be a key to finding content and keywords to target, exploring ways to create a better browsing experience, and adapting the right ideas to improve our site and achieve more conversions – and, on the other hand, competition is an item also present in the classic SWOT analysis, where it classically represents one of the threats (but in our perspective it can also become an opportunity!).
Having the information to answer questions such as “How many users visit my site every day,” “From what geographic location and with what device do they reach my pages,” “What are the most visited pages,” “How long do pages take to load” (just to name a few of the many issues that need to be investigated on a daily basis) means having the site’s metrics and its performance under control, so that we know how to intervene in terms of SEO and marketing promotion to achieve the set goals.
In short, analyzing a website is an inescapable activity, never to be neglected, and it is basic to keep an eye on the health of our project and its pages at all times and to understand what is needed (and where) to achieve maximum performance in terms of visibility and conversions.
How to do a website analysis
Analyzing the site can teach us more about the domain’s functions, its performance, and even how users interact with its structure and pages.
We can recognize at least four types of traditional site analysis:
- SEO analysis, which serves us to understand what people are looking for when they encounter our site on search engines and whether we intercept the right people; in turn, it is divided into on-page SEO analysis, technical SEO audit, off-page SEO analysis (with special attention to backlink profile monitoring), keyword analysis, and monitoring of organic returns.
- Performance analysis. Until a few years ago, it might have been sufficient to focus only on site speed analysis, a figure that helped us understand how quickly our content becomes available and usable on different devices. Speed is still important, because both users and search engines continue to prefer a fast-loading Web site over a slow one, but there are many other elements and metrics that help us compose the complex picture of actual “performance,” starting with Core Web Vitals, which investigate different performance angles of pages and the effects that any obstacles and slowdowns have on the user experience.
- Traffic Analysis. Tracking overall site traffic allows us to know precisely how many people visit the site, when where and how they access content (including their geographic location and device type), how long they stay on the page and on the site, what kind of behavior they implement compared to browsing other pages, and so on. Using tools such as Google Analytics allows us to clarify these flows and identify areas where we can best invest our resources.
- User experience. Standard website analytics is certainly useful, but it may not offer a clear competitive advantage because our competitors may also have access to the same SEO and analytics tools that we use. The breakthrough can come by changing our approach and adopting the perspective of our users – more sharply and specifically than with traffic analytics – to focus more on understanding what a visitor does when they come to the website, focusing on preferences and human behavior rather than strictly on metrics and numbers. Only in this way, in fact, can we truly understand the needs of customer visitors and give them what they came to the pages for (from whatever landing point), so as to turn them into true “users” who are loyal and ready to return again and again. Heatmap tools, session recordings, as well as feedback and voice-of-customer analysis through surveys and reviews are useful to find out how people navigate through the website, what elements they find most engaging, and what obstacles they perceive in interacting with the pages and various elements.
Setting up the analysis process
Regardless of the type of analysis we are going to perform, there are “organizational” best practices, so to speak, that allow us to make the process smoother and conduct assessments more effectively.
- Setting a goal for the analysis
Strategy essentially means “adjusting and coordinating various operations with an end goal in mind“: we can perform a Web site analysis at any time and for any reason, perhaps to better understand new search engine updates or to follow the latest optimization trends, but what should never be missed is precisely the end goal we are striving for. Knowing why we are performing analytics is a key piece in guiding actions and interventions throughout the rest of the process, and it is usually enough to focus on the most critical element we are addressing: for example, if a page is not achieving the expected conversion rate, an analysis will help us understand what to change to increase that metric, taking into consideration variables such as loading speed, mobile-friendliness or content effectiveness.
In addition to setting the goal, it may also prove important to have an ideal scenario or benchmark in mind with which to compare results, in order to plan more precisely what we hope to achieve from the analysis and the next steps needed to meet that standard.
- Collecting data
Web analytics involves collecting, reporting, and analyzing website data to identify measures based on user and organizational goals, but also to use website data to determine the success or failure of those goals and guide strategy and improve user experience-this is the definition that comes from usability.gov, for example.
The next step in the process is to use analytics tools to collect the appropriate data from the site and competitor data to understand actual performance metrics and ways in which we can intervene with improvements and fixes. The type of data to collect, the tools to use, and the tests to run during data collection depend on our analytics goal, and it is best to consider only collecting information that is directly related to the goal itself – any other unrelated data and information that we collect during collection may serve us to do specific analysis on other goals or purposes.
- Identifying areas for improvement
Now we have the initial goal and the data: we need to examine it to understand how much “waste” there is and what it depends on, analyzing the elements that may negatively affect user navigation or organic ranking and, in general, anything that is not working properly. Obviously, the next part is identifying how and where to make changes that benefit both the users of the Web site and the company as a whole, possibly even having meetings and brainstorming sessions to decide how to make these improvements and create real change.
An aspect not to be overlooked, the work is not complete after the changes are implemented, because it is crucial to continue monitoring the site and performing periodic analysis on all areas of the domain, not just those that have already been improved. This helps us to first understand whether the interventions have borne effective fruit or whether further adjustments are needed, and then it allows us to nip in the bud other critical situations on which we can intervene with a similar improvement process.
Analyzing a website with SEOZoom
Analytics tools are multiple and have multiple purposes-we have mentioned Google Analytics which is still the absolute reference for monitoring traffic, then there are tools like Hotjar that specialize in heatmaps, or the Google Search Console for tracking organic returns, PageSpeed Insights for performance, and so on-but of course we focus on the types of analysis that you can conduct thanks to SEOZoom, and in particular on site and page analysis from an SEO perspective.
The suite offers us two ways to analyze a site: the general one, by entering the domain in the search bar, and the deeper one we get by entering the site itself in a project. In both cases, we have access to a myriad of information that is very useful in the competitive intelligence phase, with accurate, up-to-date and timely data on keywords, backlinks, organic competitors and page performance.
How to analyze a site with SEOZoom
Let’s start right from the functionality of Website Analysis, which basically summarizes the behavior of the analyzed domain on Google: to launch the analysis we have to enter the address in the top bar and wait for all the analysis data uncovered by SEOZoom to load.
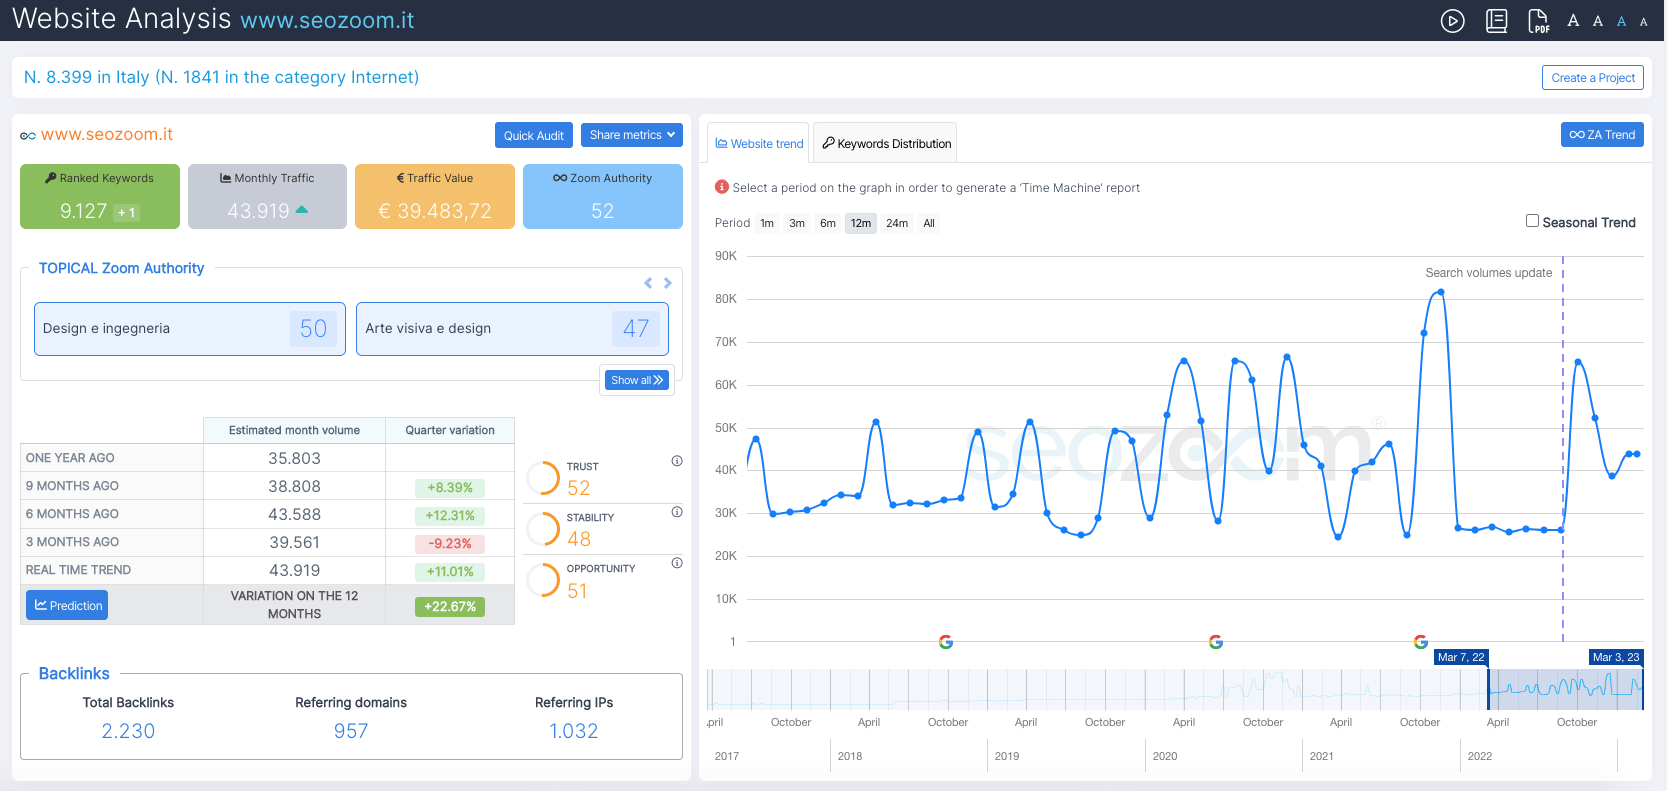
The first information we see in the initial dashboard is the domain’s position in the overall ranking of Italian sites and in its main category of relevance; if the analyzed site also manages to compete on the international versions of Google tracked by SEOZoom, moreover, here we can read a summary report of its performance, and in particular the volume of traffic (with arrow quickly indicating the trend), number of keywords placed, number of keywords present in TOP10, and Zoom Authority level, all based on that specific version of Google.
The four colored boxes summarize the site’s performance:
- Ranked Keyword indicates precisely the overall amount of keywords placed on Google and, by clicking on the box, gives access to the Keyword Studio section for further analysis on the keywords of the site under consideration.
- Monthly Traffic reports the figure on the estimated monthly traffic volume of the site’s pages, also deepened in the table just below, which reports the value of the monthly organic traffic volume of the site on a quarterly basis up to the previous year, with the possibility, by clicking on “forecast”, to launch also a forecast analysis on the next 12 months (with aggregated values and divided on a monthly basis).
- Traffic value indicates the investment we would have to make with Google Ads to get the same placements that the site got with organic traffic. The figure is on a monthly basis and the value is constructed using the sum of all Ads CPC values of the individual keywords for which the site is ranking on the first page on Google.
- Zoom Authority shows the ZA value estimated by SEOZoom. By clicking on the box, we can also check the trend of this metric over time, and also analyze the changes for the other Opportunity, Stability and Trust metrics of the domain in question. Speaking of authority, then, we can also check in detail what the site’s Topical Zoom Authority values are in all the vertical domains for which it has keywords placed, as well as the individual level of Trust, Stability and Opportunity.
This part of the tool closes with the Backlinks box, which summarizes the numbers of links received by the site, reporting their total, the domains hosting those links, and the amount of Referring IPs.
Very useful and relevant is the graph with the site’s historical trend, which reports fluctuations in traffic volume (the metric considered on the y-axis) over time (the value on the x-axis). By viewing the individual “dots” on the graph, which are SEOZoom’s scan checkpoints, we can also precisely check the date, traffic volume, and total number of keywords selected, while Google icon symbols appear on the horizontal axis, representing the dates on which relevant updates were released to the search engine’s algorithm, thus providing us with a possible key to trend reversal.
By activating the “Seasonal Trend,” moreover, we can verify on the graph any deviation between the search volume actually achieved by the site and that predicted by seasonality (represented by the curve filled in light blue). Instead, the “Keyword Distribution” tab activates the graphical visualization on the keyword ranking on Google (vertical axis) over time (horizontal axis) for the site under consideration: in this case, SEOZoom also visually shows the distribution of keywords within the first 5 pages of the search engine, distinguished chromatically. Information on the current distribution of keywords on Google for the examined site can also be found in graphical form, next to the box highlighting which Main Sectors the domain has keyword rankings for, and the distribution of traffic as a percentage with respect to only the top 5 verticals of greatest relevance.

This is followed by three tables dedicated to the analysis of the site’s keywords at different angles – top keywords, important keywords on the way up, and important keywords on the way down – which immediately provide insight into the most relevant topics for the domain and the current trend.
The last part of the Website Analysis dashboard focuses on the analysis of the entered domain’s competitors, derived automatically from SEOZoom: looking at the graph, the position of the bubbles on the left or right side indicates the volume of keywords placed, while the position at the bottom or top indicates the volume of traffic compared to the site we have taken into analysis. In this way we can quickly see how the analyzed site performs in terms of performance compared to competitors in the industry that the software has identified.
Deepening the investigation in various aspects
The analysis of a site with SEOZoom does not stop at this dashbord alone, because we can also navigate the next five tabs that take us deeper into the investigation with specific focus on some key aspects for SEO strategy: sectors, keywords, pages and organic competitors which we quickly present.
- The Sectors tab offers a strategic overview of the keywords for which a particular website is positioned in each sector identified by Google, with a range of data and information to deepen the study.
- The Keyword section available from “Domain Analysis” allows us to delve into the main aspects related to the analysis of the keywords on which the site competes, and in particular to find out which keywords are the best and potential ones, to know the ones on the way up, on the way down, those that have entered or left the TOP10, up to viewing all the keywords for which the site we are studying is positioned.
- With the Pages section, we can analyze, monitor and understand the level of optimization of the web pages of the site under study through a number of different functions and “angles”-and we will elaborate shortly on how SEOZoom specifically helps us to analyze and improve pages.
- Lastly, the competitor section is structured to allow us to quickly check and compare the analyzed site data with that of direct online competitors, automatically identified by SEOZoom based on the level of keywords in common.
Analyzing a project site: total control over the data
As mentioned, SEOZoom also offers us another method of analyzing a site, which is to enter it in a project: in fact, creating a project is the best way to take advantage of SEOZoom, because it allows us to know all the information regarding a website and view the most up-to-date statistics about its traffic and performance. The various functions and areas give us the ability to monitor keywords in a more timely manner, spy on the competition, get important information about the status of the website: in one word, we have total control over key data and insights to optimize SEO strategies and improve organic returns.

Compared to the general domain analysis, for example, project-based monitoring allows us to see the “overview” on the site, with links to the SEO Checklist, technical SEO optimization tools, the Quarterly Plan (to plan site activities based on keywords that have increasing search trends in the following months), Content Improvement (analysis of the site’s Pages based on their performance, with tips to improve them) and the Competitors check, to always have at hand a first useful info on the context in which the site operates.
Even more interestingly, from here we can go even deeper into our analysis using the various tabs available:
- From the SEO section we can carry out various analyses on the optimization of the Project, both OnPage and technical; in particular, we can check the OnPage optimization of the site, access the checklist, which presents a list of actions and verifications to guide us in the development in the management of an SEO project, as well as launch the SEO Spider analysis, so that we can delve into the state of the domain on a technical level, and the Page Speed test, based on data from Google tools.
- Browsing the Keyword submenu we can investigate the main aspects related to the analysis of the keywords on which the site competes, and in particular check the trend of the monitored keywords, find out which keywords are the best and potential ones, and still know the ones going up, down, those entering or leaving the TOP10, up to viewing all the keywords for which the projected domain is positioned.
- The Sections feature makes it possible to monitor the performance of individual and specific parts of the site, defined by a unique “path” or “route,” so that individual “micro-projects” related to these portions of the site can be practically created.
- The Competitor section is designed to allow analysis and comparison of the project site’s data with that of direct online competitors (using the list of competitors added manually at the project setup stage itself as a starting point).
Optimizing strategies: page analysis with SEOZoom
A key set of tools for our strategies can be found in the “Pages” section of the project-based monitoring, which guides us to the analysis of domain pages from different angles, so as to really manage all the key information to improve organic returns.
We only need to look at even the home page of this section to realize this: we immediately have an overview of the Yield and Crawl Budget usage, based on a set of predetermined traffic ranges. The Crawl Budget value represents an estimate made by SEOZoom of the resources Google has to devote to crawling these pages: the figure can help us quickly figure out which sections of the website are taking up the most resources and which are bringing in a higher estimated volume of traffic.

The following values are highlighted in the top three boxes:
- Wasted crawl budget: how many and what percentage of the total are very low performing pages, which therefore waste the site’s crawl budget.
- Improve your pages: a preview of how much content is “easy to optimize” according to SEOZoom, those that already have a good potential of keywords positioned on the second page on Google, and the percentage of increase on the traffic that the effects improvements could bring.
- Attainable Goal: A summary of the results that could be achieved by optimizing content, and in particular the volume of potential visits we could get by working on identified pages and keywords.
In the Site pages Performance section, which is updated weekly, we access the dedicated analysis and display, on each row of the table:
- The estimated monthly traffic range.
- The number of pages that achieve the estimated monthly traffic in the selected range.
- The contribution of those pages, i.e., the total estimated traffic volume aggregated for the pages in the selected range.
- The number of total placed keywords that are present in the pages of the selected range.
- The performance, which expresses as a percentage what is the volume of traffic derived from each of these groups of web pages relative to the total traffic volume of the site.
- The crawl budget, a bar that reports the percentage of crawl budget committed by the selected range compared to the total site.
This is followed by other tabs to take our study even deeper, specifically:
- Pages with potential, to find out which pages detected by SEOZoom have many keywords ranked on the second and third page of Google (which therefore may need a “boost” to climb the SERPs and bring more traffic to the site)
- Main Pages, which highlights the web pages of the site being analyzed that currently have the highest traffic volume, useful for understanding what the strengths of the project site are.
- Pages with the most keywords, which lists the web pages that have precisely the most keywords placed in the top five search engine pages as a whole, with the possibility of checking all the information in detail.
- Positive Trending and Negative Trending Pages, which groups pages that had respectively an increase in traffic or a decrease in traffic compared to the previous crawl.
- New Pages, which highlights project site pages that have recently entered SERPs. This section is extremely useful in various cases, because it allows, for example, to check how quickly published content manages to rank on Google or even to monitor the progress of a competitor (by projecting its site).
- Cannibalization, which analyzes the pages of the projected site by checking for multiple URLs competing for the same keywords; this tool compares web pages with each other and indicates those that compete for the same keyword, with risk of cannibalization that could hinder site performance.
Similar information to the latter tabs, but updated with different timing and with different depth, can also be found in the page analysis tools that can be reached with domain analysis (without entering the site in a project, then).
How to analyze a web page and improve an underperforming page
Page analysis with SEOZoom then helps us do a comprehensive study to understand why pages are not performing, providing us with precise information on content monitoring, newly positioned pages (also strategic for competitor study), worst pages that do not have keywords, pages with potential or with more keywords, seasonality of searches.
Therefore, it is a perfect toolkit to have a general overview of our project and optimize the online strategy, with which, for example, we can check day by day the KW performance for a new article and intervene with the right changes when the desired results are not achieved, proceeding with SERP analysis and studying the text and content structuring of the competitors ahead of us.
Identifying where to intervene with onpage corrections
By focusing only on the onpage SEO, through onpage analysis we can know if we are deficient in this respect and also understand if our content appears “adequate”-or, on the contrary, if we are trying to “push” unoptimized pages, an effort and cost that may not only prove to be in vain, but also risk being detrimental in the long run, vitiating Google and readers’ perception of the site’s overall “quality.”
When we perform a page analysis we can focus specifically on six aspects, which we can imagine as a “minimum” checklist to fine-tune a strategy that can bring more traffic and value to the project.
- Page title
As basic and trivial as it may seem, there are still many sites where no attention has been paid to the optimization of the title tag, which instead is also fundamental as a “business card,” as well as for positioning and sharing; suffice it to say that most sites are made in WordPress and this CMS transforms the title into H1, which is a fundamental markup for the positioning of the page. Also not to be overlooked is the fact that the page title is shown in Google search results and can also be used on social channels if open graph tags are not present: therefore, to try to build content with the hope of attracting traffic one can start with basic keyword research, through which to optimize the page title, using only as a next step secondary phrases (to be used in subsequent h2 through h6 tags) and avoiding using keywords that would be more precise and suitable for other pages and content, which can “cannibalize” their performance and create confusion for search engines and users.
- Meta description
Single page descriptions are another central element to immediately offer Google and readers a summary in SERP of the content they are going to find on the page and site and improve click-through rates. In this case, the invitation is to use the main keyword and not to go over the character limit, but in this regard the latest trends on optimizing this snippet are rather “nebulous”: in the past, Google first raised the maximum character threshold to 320, and then halved it to 160 (which for years was the sole standard and perhaps remains the advisable one), although the count is based on pixel count and not word count.
- Search Intent
This is actually the most important aspect of verifying that our page has the potential to compete with others that are already ranked, and more importantly that it can prove useful and effective for users. Only by understanding what the audience is looking for and asking for – summarized in the expression search intent, precisely – can we structure the content appropriately, presenting the desired information and expected responses. Identifying search intent also affects the management of onpage content, and in particular on page images and text: for example, infographics, an increasingly popular way of conveying content through an image, especially from a social perspective, have been finding a fair amount of use and application for some time now. But from an SEO perspective, one must carefully evaluate the use of such a tool, which risks making little “sense” especially if the portions of text are extensive and conspicuous: in this case, it would be better to create a standard HTML page in which to insert images and icons instead of a single infographic, accompanying it with all the necessary text and indeed trying to provide a long, well-crafted and optimized content, which may have better opportunities to rank and bring traffic than a static image.
- Internal and external links
Of the importance of including an internal link to other pages on our site we have already mentioned, but perhaps now it is good to specifically emphasize this aspect: in principle, there are two types of links to think about for on-page content optimization. The first concerns links to key pages, which serve to allow a more “long”, exhaustive and satisfactory navigation for the user; this is accomplished with classic links within the text to similar or related content, but also with the inclusion of breadcrumbs, navigation menus at the top of the page, with links to key categories of the site, or with a menu in the footer, which is also less invasive than the previous mode. The other system is links from key pages, which serve to move some traffic from pages that are best performing to those that are excluded from the main navigation, to also avoid leaving orphan pages. In addition, to “embellish” the content we can also link to external in-depth resources, which are sources used for information retrieval or authoritative articles.
- Technical aspects
As Google’s guidelines remind us, there are three basic and minimum technical elements we need to check to make sure the search engine can find, analyze and rank our pages: not blocking Googlebots, returning HTTP 200 status codes and publishing indexable content. If we have the skills to go further, we can also handle more advanced signals such as canonical tags, the choice between “www. vs. non-www.” version (which should be done in the beginning depending on our needs), the possible choice between “HTTP vs. HTTPS,” etc. – and we can use SEOZoom’s Spider to discover these elements.
- Image management
One last aspect on which we recommend focusing attention as part of an on-page SEO optimization concerns images: in addition to information such as file name and correct alt text to provide Google with the right details about the images, we must not forget to intervene from a technical point of view to optimize images, remembering that performance is a ranking factor and that presenting too “heavy” multimedia resources on the site risks being a counterproductive element especially for users from mobile.
SEOZoom’s page analysis: valuable data and insights
SEOZoom also allows us to analyze a specific page through manual entry of its precise URL, obtaining key strategic information to evaluate and optimize it.
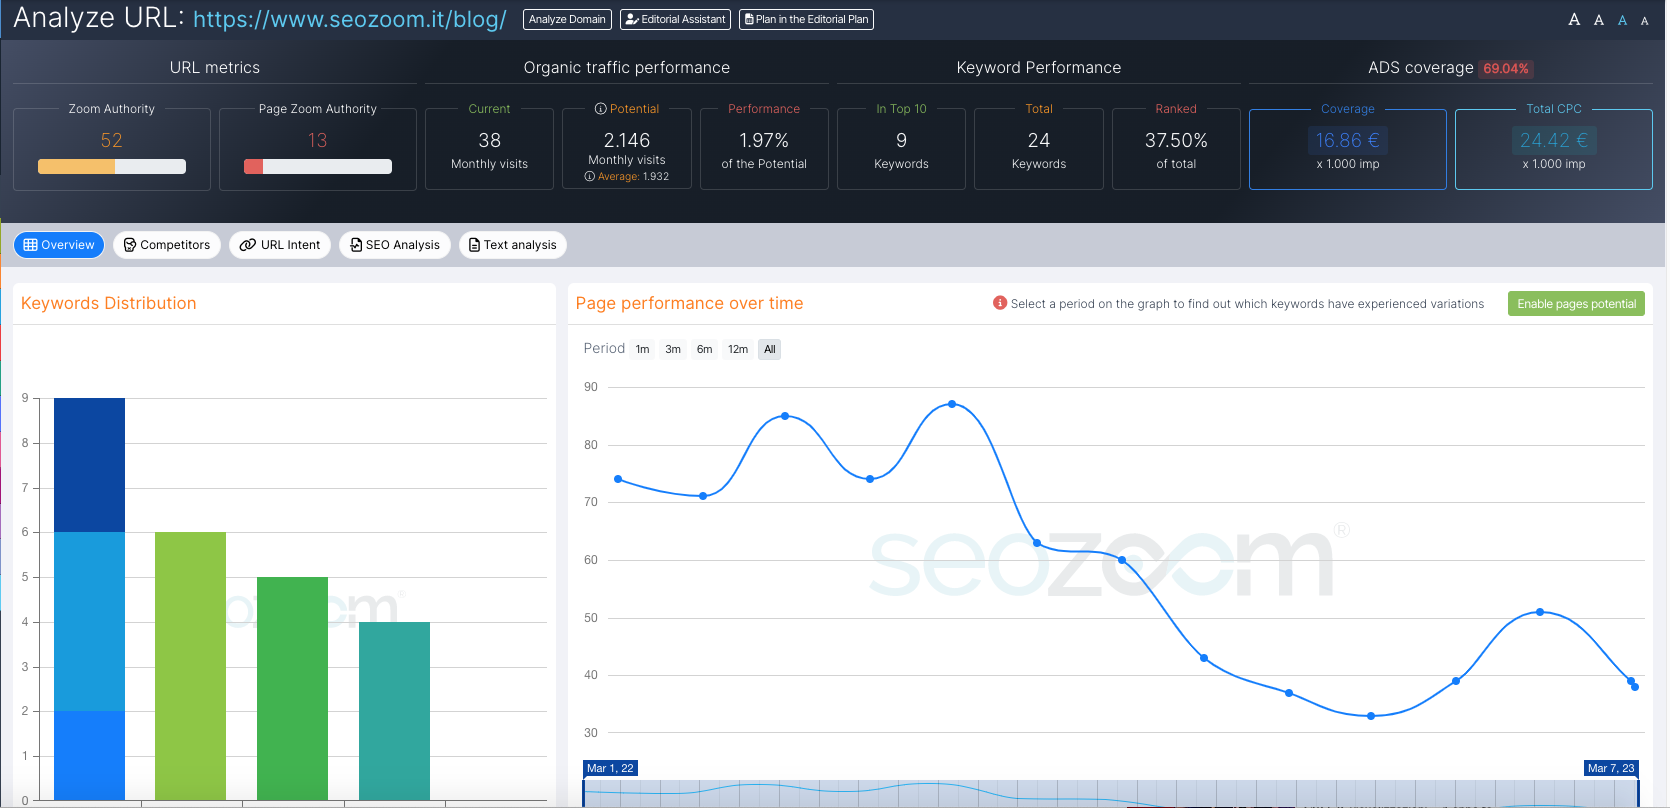
In addition to the already described functions present in the Project area, the Analyze URL features also offer very useful glimpses to improve returns with onpage interventions (or to minutely study a direct opponent’s page), and in particular the first dashboard we display presents us with:
- URL Metrics, to discover the values of Zoom Authority and PZA – Page Zoom Authority, the two original SEOZoom metrics that present a value from 0 to 100 and indicate the Page’s authority based on a mix of elements, including keywords placed on the first page, potential keywords and traffic volume.
- Organic Traffic performance, a mirror that summarizes the values of current monthly visits (in green), potential visits by bringing all keywords to the first page (in orange), and current versus potential performance (red) of the analyzed URL.
- Keyword Performance, a mirror that summarizes data on the number of keywords in TOP10 (green), total keywords in the top 50 positions (in orange), and percentage of keywords placed in TOP10 compared to the total (red).
- ADS coverage, which helps us understand by how much the “traffic value” of the page could improve if all placed keywords made it to the first page on Google. The figure represents the percentage gap between the two values presented in the boxes Coverage (the sum of the CPC of keywords are on the first page, in blue) and Total CPC (the sum of the CPC of keywords that are not currently on the first page, in light blue).
The various tabs allow us to push the analysis to a greater level of depth, accompanying us to plumb and examine virtually every aspect related to the page we are interested in and also its current level of optimization.
- Overview leads to the classic useful information about the positioning of the URL under analysis, and in particular to the distribution of the keywords positioned within the first 5 pages of Google, the graphical performance of the page itself over time (with the possibility of activating Enable page potential to enable the visual representation in the graph of the potential of the URL under analysis), the complete list of positioned keywords and any pages of the same site at risk of cannibalization, because they are related to the same topic or competitors on the same keywords.
- Competitors allows you to analyze pages from other domains that compete with the one under analysis, automatically identified by SEOZoom on the basis of common keywords.
- URL Intent is an innovative function of SEOZoom that, thanks to its algorithm, is able to identify the main keyword of the search intent underlying the analyzed content and, in this way, study the performance of the page going beyond the “old” analysis systems. In this way, we can examine the Search Intent related to the URL under analysis, with a series of data inherent to the intent match, competitiveness, and keywords related to the topic.

The dashboard immediately shows 5 boxes: the first one tells you the main keyword identified by SEOZoom (and gives the possibility to possibly change it manually, if we think the main keyword of that URL is another one) with its range of monthly search volume; the Total Main Intent Volume (i.e. the total search volume formed by all the keywords pertaining to the search intent identified for the URL); the Intent Match Percentage (how well the analyzed page centers the search intent); the URL Competitiveness Percentage (which indicates how competitive the analyzed page is, i.e., it succeeds in competing on all the keywords pertaining to the search intent); Best URL indication for the identified intent (which indicates precisely which page is getting the best performance and most traffic for the identified search intent). Immediately below are useful indications related to possible secondary keywords that it might be useful to consider in a content strategy that wants to go deeper into the topic, with related articles or with optimization of the content already published. Specifically, SEOZoom tells you which articles are already present that should be improved, which articles only partially intersect the intent, and finally, which topics are not currently covered in any articles.
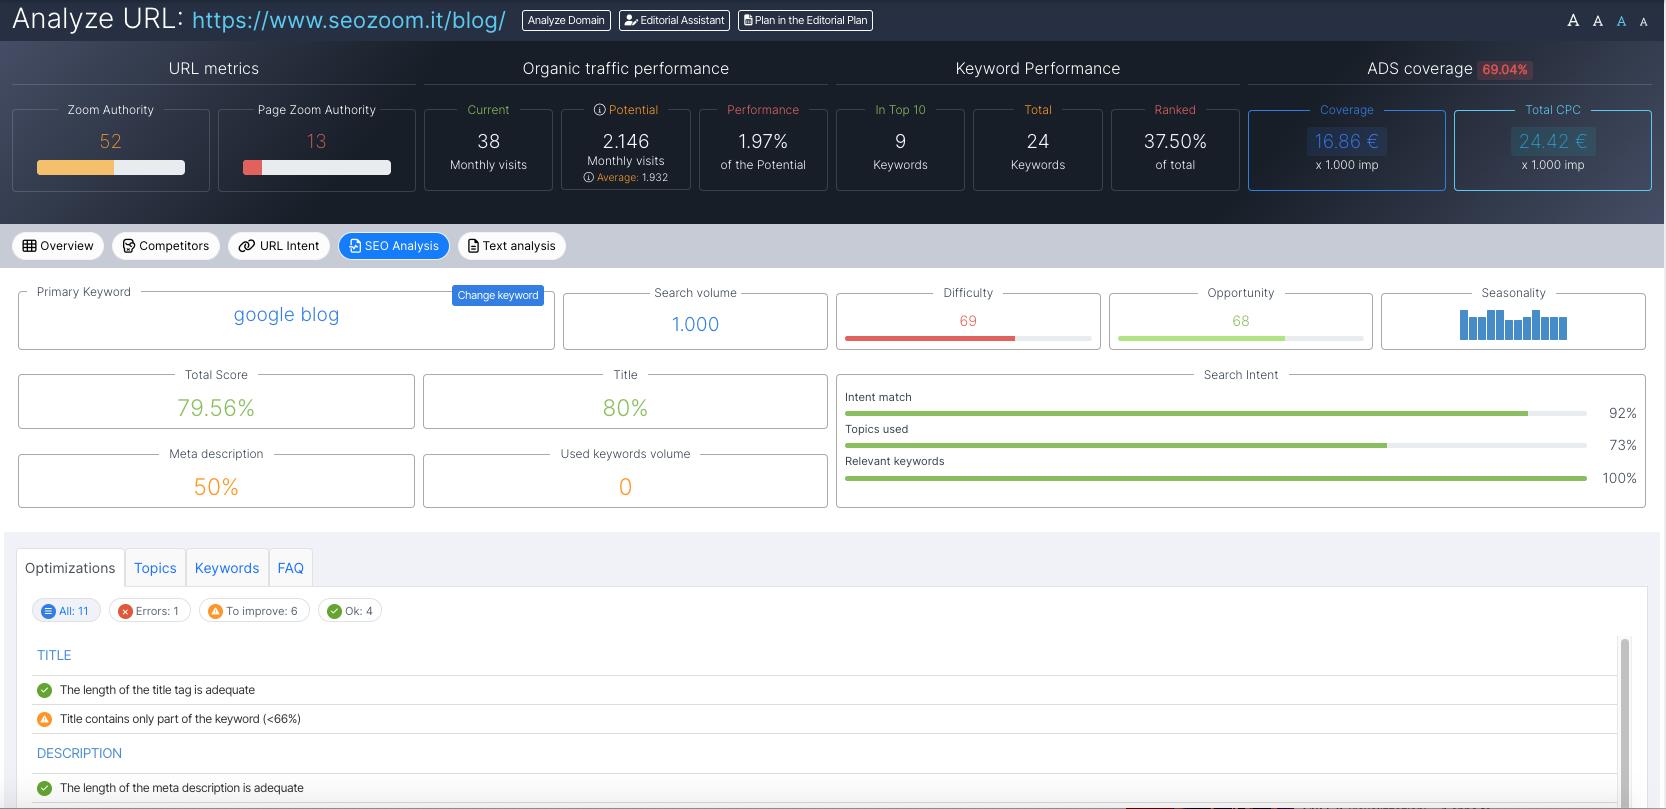
- SEO Analysis provides a comprehensive, real-time analysis on the optimization of the Page in relation to the indicated key, which can also be varied in case we are interested in delving into a different keyword than the one identified by SEOZoom. Among the various in-depth data on the level of optimization of the content we find, in particular, a box that reports the main key and its values, and then still another box focused on Search Intent, which analyzes the text of the content to determine the value of Intent Match, Topic used and Relevant Keyword, and another section that shows us what the title and meta description set and, again, the level of optimization of the page estimated by SEOZoom for the various parameters. Other suggestions come from the tabs that delve into level of optimization of the content of the page under consideration between Optimizations (points to consider in order to have a well-optimized article based on SEO best practices, both technical and structural); Keyword (keywords potentially inherent to the target keyword identified, divided into All, Fundamental, Recommended, Optional, Additional, Missing, with an indication of the use made by competitors positioned in the top10 in headers, links, images and phrases); Topic (recurring topics related to the chosen keyword) and FAQ (frequently asked questions from users regarding the topic, as identified by Google).
- Text Analysis provides a graphical view of the content structure and thus allows us to take a view of how keywords are used on the page, either in the form of a pie chart with the most frequently used phrases or in the bar graph version. In addition, the table allows us to deepen this analysis by listing all the keywords on highlighted, separated according to the extent of the keyword (i.e., whether it consists of one word, two words, and so on, up to 6 words).