Guide to Time To First Byte: what it is and how to optimize pages
It is a metric that is not part of the Core Web Vitals, but it anticipates (and in some ways underlies and influences) one of these parameters and more: in short, paying attention to it is not mandatory from a ranking perspective, but it is definitely a recommended practice to improve overall site performance and user experience on our pages. Let’s find out everything we need to know about Time To First Byte, a useful indicator for the responsiveness of the web server and network resources involved in serving the site, analyzing the theoretical aspects and also the more concrete interventions to optimize our pages.
What is Time To First Byte or TTFB
Time to First Byte – usually referred to by the acronym TTFB – is a fundamental metric of web performance that refers to the time between when a browser requests a page and when it receives the first byte of information from the server.
This time for the first byte therefore helps determine the responsiveness of a web server, because it measures the amount of time that elapses between creating a connection to the server and actually downloading the contents of a web page, including DNS lookup and establishing the connection using a TCP handshake and an SSL handshake if the request is made via HTTPS.
What TTFB measures and why it is important for sites (and SEO)
TTFB is a metric that measures the time between the request for a resource and the start of sending the first byte of a response and is critical for measuring connection setup time and Web server responsiveness both in the lab and in the field.
Specifically, it can help us identify whether the Web server is too slow to respond to requests, and-in the case of browsing requests, i.e., requests for an HTML document-it precedes any other significant metric of loading performance. In particular, it precedes two significant user experience metrics such as First Contentful Paint (FCP) and especially Largest Contentful Paint (LCP), which we know is a Google Core Web Vitals, and thus high values of TTFB add time to the metrics that follow it, negatively affecting the quality of the user experience and, consequently, also Google’s judgment.
Specifically, Time to First Byte measures in milleseconds the time between the start of the HTTP request sent by the user’s browser and the first byte returned by the server; when the browser begins to receive content, it can start building the page in front of the user.

From a technical perspective, TTFB is the sum of the following request steps, as this useful insight by Jeremy Wagner and Barry Pollard on web.dev explains:
- Redirect time.
- Service worker startup time (if applicable).
- DNS lookup.
- TLS connection and negotiation.
- Request, up to the point where the first byte of the response arrived.
As a further useful indication, Googlers anticipate that reducing latency in connection setup time and on the back-end helps reduce TTFB.
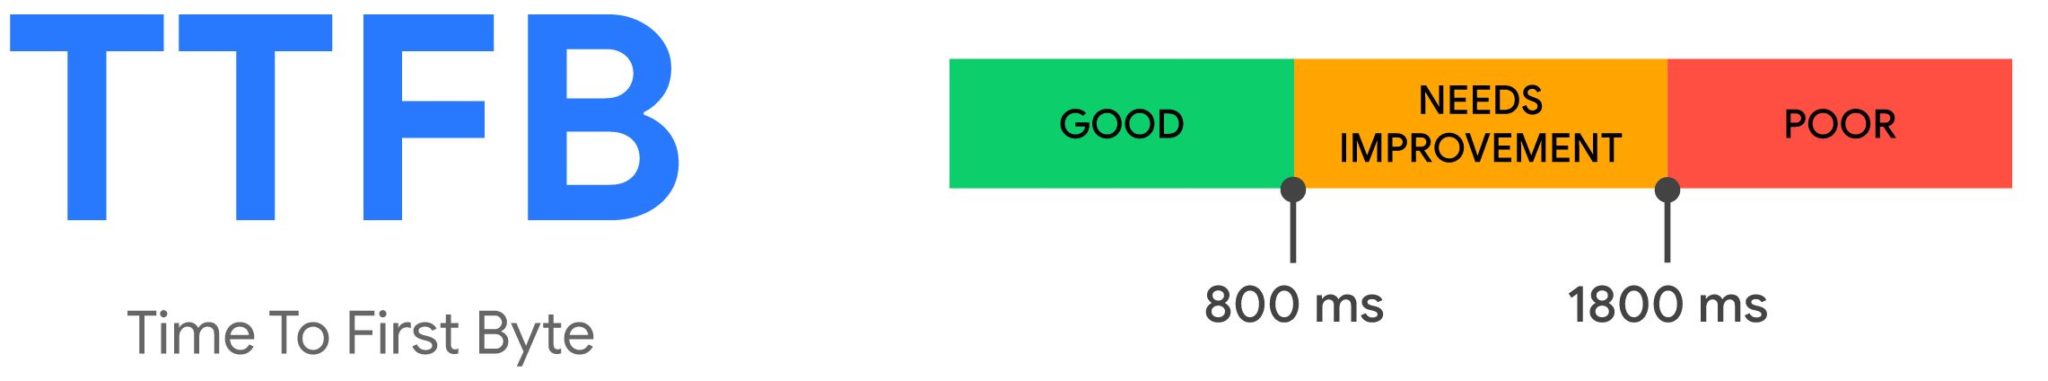
What are the Time To First Byte values and what they mean
Websites have different ways of delivering content, and so TTFB thresholds are a “rough guide” and must be weighed against how the specific individual site serves its core content.
In general, Google considers it advisable for the server to respond to browsing requests quickly enough so that the 75th percentile of users experience a FCP within the “good” threshold. To give a rough benchmark value, most sites should strive for a TTFB of 0.8 seconds or less.
A low TTFB is critical to getting the markup to the client as quickly as possible, but as we said a lot depends on the characteristics of the site. For example, the Insight says again, if a Web site provides initial markup quickly, but that markup requires JavaScript to populate it with meaningful content – as in the case of Single Page Applications (SPAs) – achieving the lowest possible TTFB is especially important so that client-rendering of the markup can occur sooner.
Conversely, a server-rendered site that does not require as much client-side work can have a slightly higher and lower TTFB, as long as good FCP and LCP values are guaranteed.
Basically, then, we should not forget that TTFB is not a Core Web Vitals metric, so it is not absolutely necessary for sites to meet the “good” TTFB threshold, as long as it does not impede their ability to score well in the metrics that matter.
How to measure TTFB
Time to First Byte can be measured in the lab or on the field.
The field tools are Chrome User Experience Report and the Javascript web-vitals library, while the lab tools are in Chrome’s DevTools network panel and WebPageTest.
As Wagner clarifies in a second insight, it is important to look at how this metric actually affects website users: the primary source for verifying TTFB in this sense is field data because the metric is affected by redirects, whereas lab-based tools are often measured using the final URL, so they lack this additional lag.
In a more practical sense, as with the optimization of any metric, the recommended approach is to measure TTFB on the field, use lab-based tools to delve into the causes, and then apply optimizations where possible. We must then keep an eye on the data in the field and make the necessary changes to ensure that the user experience is as fast as possible.
In JavaScript, we can measure the TTFB of browser requests with the Navigation Timing API. In the example in the image, we see how to create a PerformanceObserver instance that listens for a navigation entry and records it in the console:
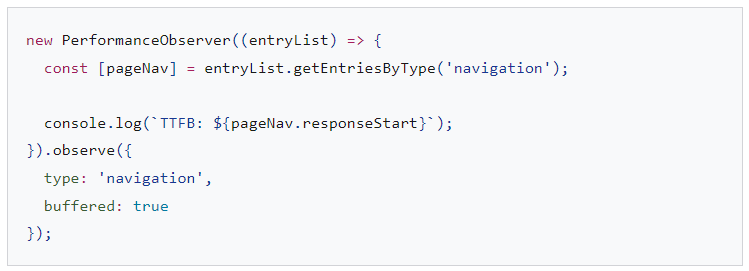
However, not all browsers support PerformanceObserver or its buffered flag: to get as much browser support as possible, we should consider adopting the web-vitals package.
Again in the JS domain, in fact, the web-vitals library can measure TTFB in the browser with less complexity, as shown below:

However, there is another aspect to consider: TTFB applies to all requests, not just browsing requests, and in particular resources hosted on multiorigin servers may introduce latency due to the need to set up connections to those servers.
It may therefore be more appropriate to measure TTFB with resources in the field, using the Resource Timing API within a PerformanceObserver: this code snippet is similar to that used to measure TTFB for a navigation request, except that instead of querying the “navigation'” entries, it queries the “resource” entries. It also takes into account the fact that some resources loaded from the primary source may return a value of 0 because the connection is already open or a resource is retrieved instantly from a cache.
Again, there is a very important however: the TTFB for cross-origin requests will not be measurable on the field if the cross-origin servers fail to set a Timing-Allow-Origin header.
How to tell if the Time to First Byte is high
We can use the Server-Timing response header in the back-end of our application to measure distinct back-end processes that might be contributing to high latency. The header value structure is flexible and accepts, at a minimum, a handle we define: optional values include a duration value (via dur), as well as an optional user-readable description (via desc).
Serving-Timing can serve to measure many back-end processes of the application, but there are a few to pay special attention to:
- Database queries.
- Server-side rendering time, if applicable.
- Disk seek.
- Hit/Miss in the edge server cache (if using a CDN).
All parts of a Server-Timing entry are separated by a colon, and multiple entries can be separated by a comma. The header can be set using the language chosen by the back-end of the application, and the following is an example done in PHP:
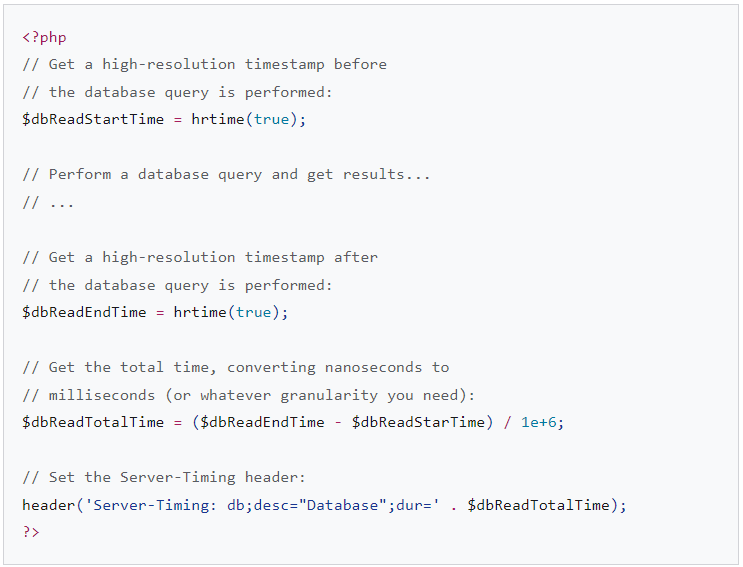
By setting this header, information emerges that we can use both in the lab and in the field.
In the field, any page with a Server-Timing response header set will populate the Server-Timing property in the Navigation Timing API:
In the lab, the data from the Server-Timing response header will be displayed in the timing pane of the Network tab in Chrome DevTools:
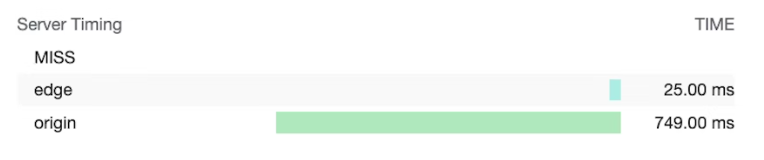
In this image, the Server-Timing header values measure whether or not a CDN edge server has detected a cache hit or miss, as well as the time it takes to retrieve the resource from the edge and origin server. In practice, therefore, Server-Timing in this case is used to measure whether a request for a resource has reached the CDN cache and how long it takes the request to reach the CDN edge server and then the origin.
If measuring back-end Server-Timing latency is not feasible, then a suitable alternative might be to rely on Application Performance Monitoring (APM) to detect and diagnose back-end performance problems.
How to optimize Time To First Byte and serve content faster
After determining the presence of a problematic TTFB by analyzing the available data, we can move on to troubleshooting the problem and optimizing the parameter.
According to Wagner, the most challenging aspect of Time To First Byte optimization is that while the frontend stack of the Web will always be HTML, CSS and JavaScript, the backend stacks can vary significantly. There are numerous backend stacks, their combinations, and database products, each with their own optimization techniques, and so it is not possible to encapsulate in one article everything we can do to lower the TTFB of our Web site.
The following tips, then, represent some options we can explore to try to make things work a little faster on the server side and apply to most architectures.
The platform used to host the website can have a strong impact on TTFB: for example, WordPress performance is affected by the number and quality of plugins or themes used, and so too are other platforms affected by the level of customization applied.
Check the hosting
Before even considering other optimization approaches, hosting should be the first thing to consider, says the Chrome DevRel team’s developer guide, adhering to a rather intuitive rule of thumb: the website host must be able to handle the traffic we send.
Shared hosting will generally be slower, but this may not be a problem for those running a small personal Web site that serves mainly static files (which can still apply some of these optimization techniques to reduce TTFB); on the contrary, if we run a larger application with many users that involves customization, database querying, and other intensive server-side operations, the choice of hosting becomes critical to reducing Time To First Byte on the field.
When choosing a hosting provider, we must pay attention to a few aspects:
- Amount of memory allocated to the application instance. If the application does not have enough memory, it will crash and struggle to serve pages as fast as possible.
- Does the hosting provider keep our back-end stack up to date? As new versions of the application’s back-end languages, HTTP implementations, and database software are released, the performance of that software will improve over time, so it is critical to turn to hosting providers that prioritize this crucial maintenance.
- If we have very specific application requirements and want lower-level access to server configuration files, we can consider customizing the back-end of our application instance.
To evaluate the real-user TTFB performance of each hosting provider and check those of its competitors, we can visit ismyhostfastyet.com (run by another Googler, Rick Viscomi), which carries precisely all the useful information.
Using a CDN
The advice to turn to a Content Delivery Network often comes up again and again in talks related to site performance optimization and technical SEO, and it’s for good reason, Wagner says: even if we have a very well-optimized application back-end, users who are located far from the origin server may still experience high TTFB in the field.
CDNs solve the problem of user proximity from the origin server by using a distributed network of servers — called edge servers — that cache resources on systems that are physically closer to the users who request them.
In addition to edge servers, CDN providers can also offer other benefits such as:
- CDN providers usually offer extremely fast DNS resolution times.
- A CDN will likely serve content from edge servers using modern protocols such as HTTP/2 or HTTP/3.
- HTTP/3 in particular solves the head-of-line blocking problem present in TCP (on which HTTP/2 is based) using the UDP protocol.
- A CDN will probably also provide modern versions of TLS, thus reducing the latency involved in TLS negotiation time-TLS 1.3 in particular is designed to keep TLS negotiation as short as possible.
- Some CDN providers provide a feature often called an “edge worker“, which uses an API similar to the Service Worker API to intercept requests, manage at the code level responses in edge caches, or rewrite responses altogether.
- CDN providers are very good at optimizing compression – which is difficult to achieve on your own and can lead to slower response times in some cases with dynamically generated markup that must be compressed on the fly.
- CDN providers will also automatically cache compressed responses for static resources, leading to the best combination of compression ratio and response time.
Although adopting a CDN involves varying amounts of effort, from trivial to significant, it should be a high priority to pursue in TTFB optimization.
Avoid multiple page redirects
A potential contributing factor to high TTFB are redirects, which occur when a navigation request for a document receives in response from the browser information that the resource exists in another location. A single redirect can certainly add unwanted latency to a browsing request, but it can get even worse if that redirect points to another resource that results in another redirect and so on-the famous redirect chain.
There are two types of redirects, Wagner summarizes:
- Same-origin redirects, in which the redirection occurs entirely on the same website.
- Cross-origin redirects, in which the redirection initially occurs on another origin-for example, from a social media URL shortening service-before arriving at the website.
Clearly, we need to focus on eliminating same-origin redirects, because it is these that we have direct control over by going to check the internal links on our Web site to see if any of them result in providing in a 302 or 301 response code.
Cross-origin redirects are more complicated, as they are often beyond our control, but we can as a coffin rule avoid multiple redirects whenever possible, for example by using multiple link shorteners when sharing links.
Another major source of redirect time can come from HTTP to HTTPS redirects. One way around this is to use the Strict-Transport-Security (HSTS) header, which will enforce HTTPS on the first visit to an origin, then tell the browser to immediately access the origin via the HTTPS scheme on future visits. Once we have a good HSTS policy in place, we can speed things up on the first visit to an origin by adding the site to the HSTS preload list (but the article also warns to be cautious when implementing HSTS, as setting up an overly aggressive policy without sufficient testing can harm the website).
Managing the transmission of markup to the browser
Browsers are optimized to process markup efficiently when it is streamed, which means that markup is handled in blocks as it arrives from the server. This is critical with regard to large markup payloads, as it allows the browser to parse blocks of markup incrementally, rather than waiting for the entire response to arrive before it can begin parsing.
Although browsers are good at handling markup delivery, it is critical to do everything possible to keep the stream flowing so that those initial bits of markup are arriving as soon as possible, and it is a problem if the back-end is blocking things.
In JavaScript, for example, React and other frameworks that can render markup on demand on the server have used a synchronous approach to server-side rendering; however, newer versions of React have implemented server methods for streaming markup directly during rendering, and this implies that there is no need to wait for a React server API method to render the entire response before it is sent.
Not all JavaScript runtimes can take advantage of server-side streaming rendering, however: newer ones like Deno support it immediately, but older versions of Node.js may not support it.
Another way to ensure that markup is transmitted quickly to the browser is to rely on static rendering, which generates HTML files during compile time. With the full file immediately available, Web servers can begin sending the file immediately, and the inherited nature of HTTP will result in streaming markup. Although this approach is not suitable for all pages on all Web sites, such as those that require a dynamic response as part of the user experience, it can be beneficial for those pages that do not require markup customization for a specific user.
Use a service worker
The Service Worker API can have a great impact on TTFB for both documents and the resources they load, because a service worker acts as a proxy between the browser and the server, but the eventual impact on the Web site’s TTFB depends on how we set up the service worker itself and how well this configuration aligns with the application’s requirements.
- Use a stale-while-revalidate strategy for assets. If an asset is in the service worker’s cache, whether it is a document or a resource requested by the document, the stale-while-revalidate strategy will first servethat resource from the cache, then download that asset in the background and serve it from the cache for future interactions.
– If we have document assets that do not change very often, using a stale-while-revalidate strategy can make the TTFB of a page almost instantaneous. However, this does not work so well if the website sends dynamically generated markup, such as markup that changes based on whether a user is authenticated: in these cases, it is always best to reach out to the network first, so that the document is as up-to-date as possible.
– If the document loads noncritical resources that change with some frequency, but retrieving the outdated resource will not greatly affect the user experience, such as selected images or other resources that are not critical, the TTFB for those resources can be greatly reduced by using a stale-while-revalidate strategy. - Use a streaming service worker architecture if possible. This service worker architecture uses an approach in which parts of a document resource are cached in the service worker cache and combined with content partials during the browsing request. The resulting effect of using this service worker model is that browsing will be quite fast while smaller HTML payloads are downloaded from the network. Although this service worker model does not work for all Web sites, TTFB times for document resources can be virtually instantaneous for sites that can use it.
- Use the app shell model for client-rendered applications. This model is best suited to SPAs where the page “shell” can be delivered instantaneously from the service worker cache and dynamic page content is populated and rendered later in the page lifecycle.
Use 103 Early Hints for critical rendering resources
No matter how well the back-end of the application is optimized, there may still be a significant amount of work that the server must do to prepare a response, including expensive (but necessary) database work that delays the arrival of the navigation response as quickly as possible. The potential effect of this is that some subsequent critical rendering resources may be delayed, such as CSS or, in some cases, JavaScript rendering markup on the client.
The 103 Early Hints header is an initial response code that the server can send to the browser while the back-end is busy preparing markup, and it can be used to suggest to the browser that there are critical rendering resources that the page should start downloading during markup preparation. On supported browsers the effect can be faster rendering of documents (CSS) and faster availability of main page functionality (JavaScript).
However, if our site does not do much back-end processing to prepare the markup, as is the case with static sites, 103 Early Hints will probably not be of much help, because it tends to work best for sites that require considerable back-end time before the markup can be sent to the user.