Guide to LCP – Largest Contentful Paint, the loading metric

Largest Contentful Paint or LCP, and is a crucial metric for user experience because it measures the time it takes for a page to load the largest content element in the visible area as a result of a user request. Not coincidentally, Google included LCP among the first Core Web Vitals, the metrics that became a ranking factor with the Page Experience update, requiring us to focus our attention on the technical aspects related to calculating and evaluating the experience offered by pages.
What is LCP, the Largest Contentful Paint metric
LCP is an important and user-centric indicator to measure the loading speed perceived by users, because it “marks the point in the loading timeline of the page where the main content of the page is probably loaded“, says Philip Walton inside the precious guide on web.dev.
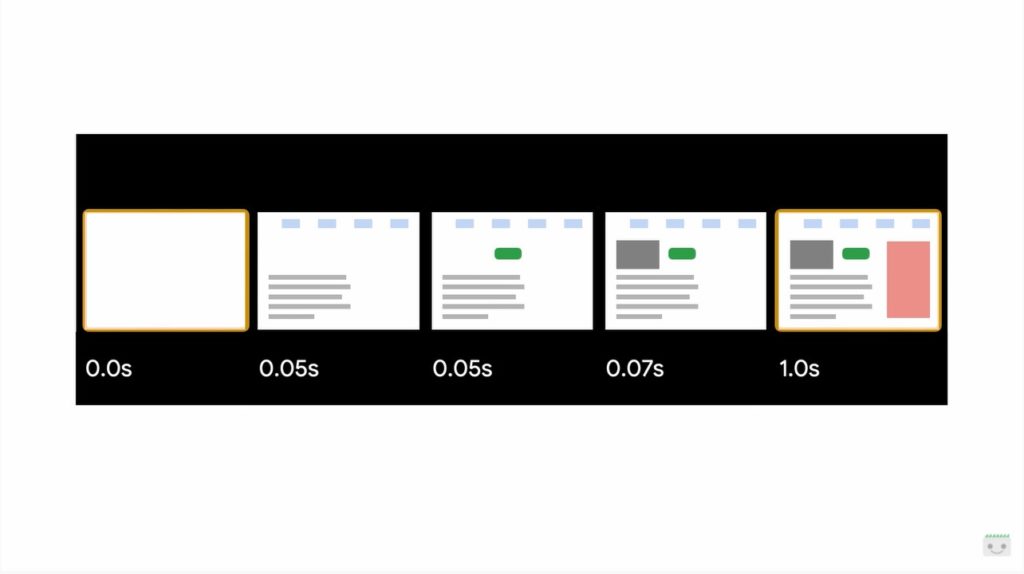
Basically, the Largest Contentful Paint indicates the time it takes a page to load its more challenging content from the window taken into account by the device; usually, the larger content is an image, a video or a large text element at the block level.
Thus, the LCP measures the wait needed for the user to render the larger and more visible element, and a quick data “helps to reassure the user that the page is useful”, because it is a signal that the URL is being uploaded.
An indicator of perceived loading’s real speed
Measuring the speed with which the main content of a web page is loaded and is visible to users is one of the most challenging challenges for developers, who have tried various paths: as Walton tells, older metrics “as load or Domcontentloaded are not good because they do not necessarily correspond to what the user sees on their screen”, and the same First Contentful Paint (FCP), while being user-focused, “only captures the beginning of the loading experience” and is therefore too generic, because “if a page shows a home screen or an upload indicator, this time is not very relevant to the user”.
This is why the LCP value has been imposed which, by calculating the loading time of the largest and most problematic element on the page, it demonstrates a more accurate way to measure when the main content of a page is actually loaded for how it is perceived by the user.
LCP and Core Web Vitals
It is therefore not surprising that Google chose to include the Largest Contentful Paint among the Core Web Vitals, the essential web signals that allow to measure concretely the experience provided by the pages: next to the indicator to know the visual stability (Cumulative Shift Layout) and that of interactivity (First input delay), then, Google adds the measurement of loading as a discriminating for pages that offer positive experiences and those that, instead, are lacking.
How to measure the LCP: scores and meaning
The Largest Contentful Paint metric then shows the rendering time needed for the largest image or text block visible within the window.
An LCP score is good when less than 2.5 seconds, while a value greater than 4 seconds is very low and “everything in the middle needs to be improved”, according to the expert.
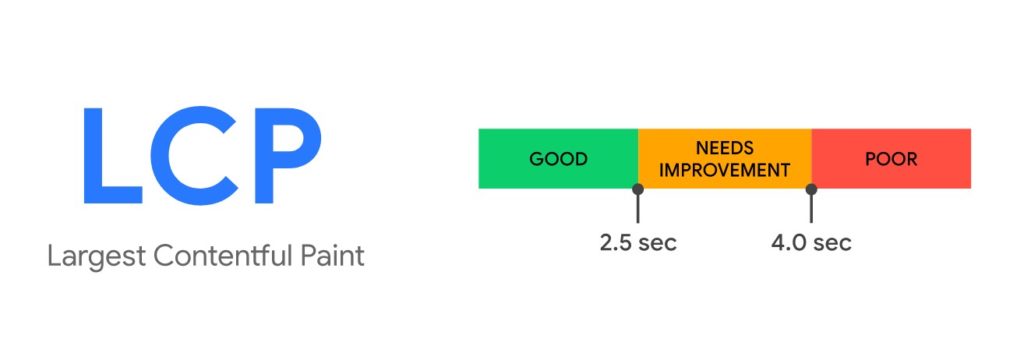 To provide a good user experience, sites should strive to secure the LCP within the first 2.5 seconds from the start of page loading; to be sure to achieve this goal for most of our users, A good threshold to measure is the 75 % percentage of page uploads in a certain range (aggregated Lcps), segmented between mobile devices and desktops.
In practical terms, to provide this value, the Google Search Console monitors loading times and orders them increasingly, from the smallest to the largest, taking as a measure the value of time that corresponds to the 75th percentile, the first 75% of times measured. This choice is explained by the need to understand the largest majority of times recorded so as to have a reliable reference that for most users the loading experience was positive.
Which elements are taken into account
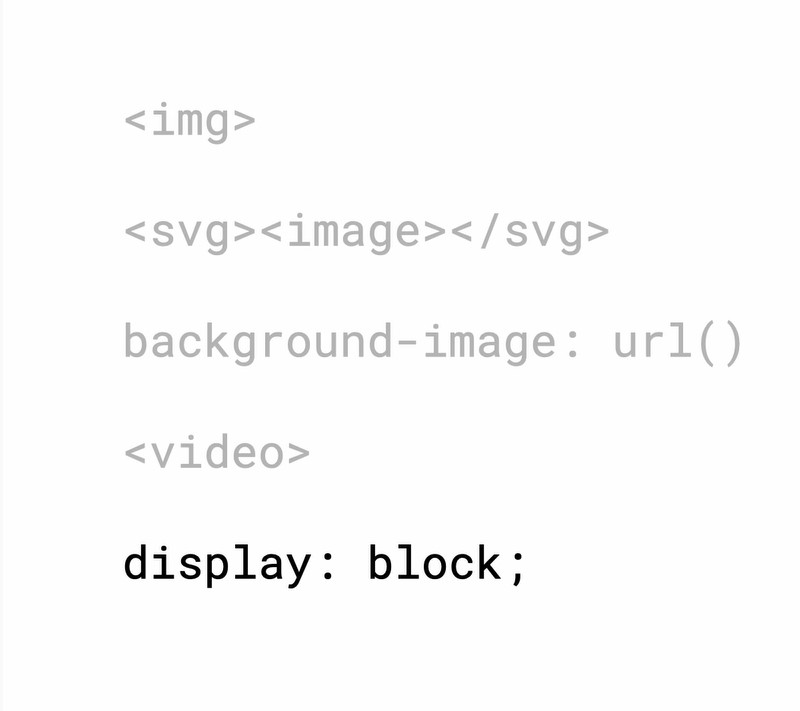
As currently specified in the Largest Contentful Paint API, the types of elements considered for Largest Contentful Paint are few by choice (to keep things simple at the beginning, with the possibility of adding more elements in the future), namely:
- <img> elements
- <image> elements inside an <svg> element
- <video> elements (the poster image is used)
- An element with a background image loaded via the url() function (as opposed to a CSS gradient)
- Block-level elements containing text nodes or other secondary text elements at the line level.
How the size of an element is calculated
The size of the item reported for Largest Contentful Paint is typically “the size visible to the user within the window”. If the element extends outside the viewport, or if any of the elements are cut or overflow is not visible, those parts are not counted for the size of the element.
For image elements that have been resized from their intrinsic size (that is, the original one, in Google’s language), the visible size or the intrinsic size is reported “depending on which is the smallest”. For example, images “reduced to a size much smaller than the intrinsic one will report only the sizes in which they are displayed, while images stretched or expanded to a larger size will report only their intrinsic dimensions”.
Simplifying with an example: if we load an image of 2048 pixels wide and 1152 pixels high, 2048 x 1152 are considered “intrinsic” dimensions. If we resize the image to 640 x 360 pixels, 640 360 will be the visible size; for the purpose of calculating the image size, Google uses the smaller size among the images of intrinsic and visible size, and it is considered a best practice to make sure that the intrinsic size of the image corresponds to the visible size, because so the recurring will be downloaded faster and the LCP score will increase.
For text elements, only the size of their text nodes is considered (the smallest rectangle that encloses all text nodes).
For all elements, any margin, fill or edge applied via CSS is not considered.
Tools to measure the Largest Contentful Paint
LCP is an easy metric to understand: just look at the web page and determine which is the largest text block or image and then optimize it, making it smaller or removing anything that can prevent a quick download.
The LCP data can be measured in the laboratory or on the field and is available in several instruments:
- Field tools (actual measurement of a site).
- Chrome User Experience Report
- PageSpeed Insights
- Search Console (Core Web Vitals report)
- JavaScript web-vitals library
- Lab tools (provide a virtual score based on a simulated scan using algorithms that approximate the Internet conditions that a typical user might encounter on a smartphone).
- Chrome DevTools
- Lighthouse
- WebPageTest
Optimizing the Largest Contentful Paint
Having clarified the main descriptive aspects of this metric, let’s find out what we can do in practice to improve the performance on LCP and then speed up the rendering on the screen of the main content of the page to provide a better user experience.
According to Google, the most common causes of a poor LCP are:
- Slow server response times
- Javascript and CSS that block the rendering
- Slow Resource Loading Times
- Client side rendering
For each of these fronts, Houssein Djirdeh (still on web.dev) offers a detailed guide to fix the issue and optimize the Largest Contentful Paint.
Solving the server delay issues
The longer it takes a browser to receive content from the server, the more time it will take to view anything on the screen, and then increase the server response time “directly improves every single page loading metric, including LCP”.
The expert recommends that you first focus on improving “how and where your server manages your content“, using the Time to First Byte (TTFB) metric to measure server response times and improve the data in one of the following ways:
- Optimize the server, analyzing and improving the efficiency of the server-side code to directly influence the time needed for the browser to receive data (and solving any overloaded server problem).
- Direct users to a nearby CDN network (to avoid users having to wait for network requests to distant servers).
- Cache asset: cache storage is suitable for sites with static HTML code, which should not be changed at every request, and prevents its unnecessary recreation, minimizing the use of resources.
- Serve cache-first HTML pages: through a service worker executed in the background of the browser it is possible to intercept the requests from the server, storing in the cache part or all the contents of the HTML page and updating the cache only when the content has changed.
- Establishing third-party connections in advance: Server requests originating from third parties may also have an impact on LCP, especially if they are needed to view critical content on the page.
Intervening on JavaScript and CSS rendering blocks
Scripts and stylesheets are both render blocking resources that delay FCP and consequently LCP; Google invites you to “defer any non-critical Javascript and CSS so to speed up the loading of your webpage’s main content”.
More precisely, the net advice is to “completely remove any unused CSS or move it to another stylesheet if used on a separate page of your site”. One way to do this is to use loadCSS to load files asynchronously for any CSS not needed for initial rendering, using rel = “preload” and onload.
Similar work must be done to optimize Javascript, starting with “downloading and offering users the minimum amount of Javascript needed“, because “reducing the amount of Javascript blocks results in faster rendering and, consequently, a better LCP”.
Improving the loading time of slow resources
There are some ways to ensure that critical files are uploaded as quickly as possible, such as:
- Optimize images.
- Preload important resources (such as fonts, images or videos above the fold and CSS or Javascript for critical paths).
- Compress text files.
- Provide different resources based on network connection (Adaptive serving)
- Cache assets using a service worker
Optimizing client-side rendering
Many sites use client-side Javascript logic to render pages directly in the browser, but this may have a negative effect on LCP when using a large Javascript package.
In particular, if no optimizations are in place to prevent it, users may not see or interact with any content on the page until all critical Javascript has finished downloading and running.
When creating a client-side rendering site, Djirdeh suggests making three types of optimization:
- Minimize critical Javascript.
- Use server side rendering.
- Use the pre-rendering.
The LCP metric, to measure users’ perceived wait time
The previous systems to measure the loading of pages had the defect of partiality and of being focused only on technical aspects: in the new appointment with the series “Getting started with Page Experience” on Youtube, the Developer Advocate recalls for example that “people who use our site do not care when activating a dom event“, does not help us a document.unload that remains a “milestone quite insignificant for a user” nor the “first contentful paint, because the first thing painted is not necessarily always so useful”.
That is when the LCP metric supports us, by allowing us to “take a step back from the problems and provide an answer to the questions that matter most to our users on the web today”, and in particular to meet the fundamental demand to get the best user experience possible. With Largest Contentful Paint, in fact, we know “when a page is usable or rather when users think it is usable”, and this gives us the way to know “the precise point at which most users perceive that a web page has been loaded“.
What is the LCP, definition and explanation of the term
Kettner then tries to define what the Largest Contentful Paint is, the metric that measures how quickly the main content of a page loads and renders (or paints) most of its visual elements on the screen.
The term paint refers to “a paint event” (browser terminology): a paint event occurs “when pixels on the screen are rendered or painted each time a pixel changes the color on the screen” – and thus, in summary, “when a pixel changes is a paint”.
As with the other web vital events discussed in this series – for example the optimization of the First Input Delay – paint events “are exposed as performance that we track and analyze through the performance Observer browser api”: every time the browser paints “we know and understand that every single element of the page is loaded”.
Contentful paint, instead, are more precisely paint events that draw pixels of a handful of dom elements, and in particular image elements, image elements used within svg, elements with background image, video elements and block level elements (as in display blocks) when they contain text.
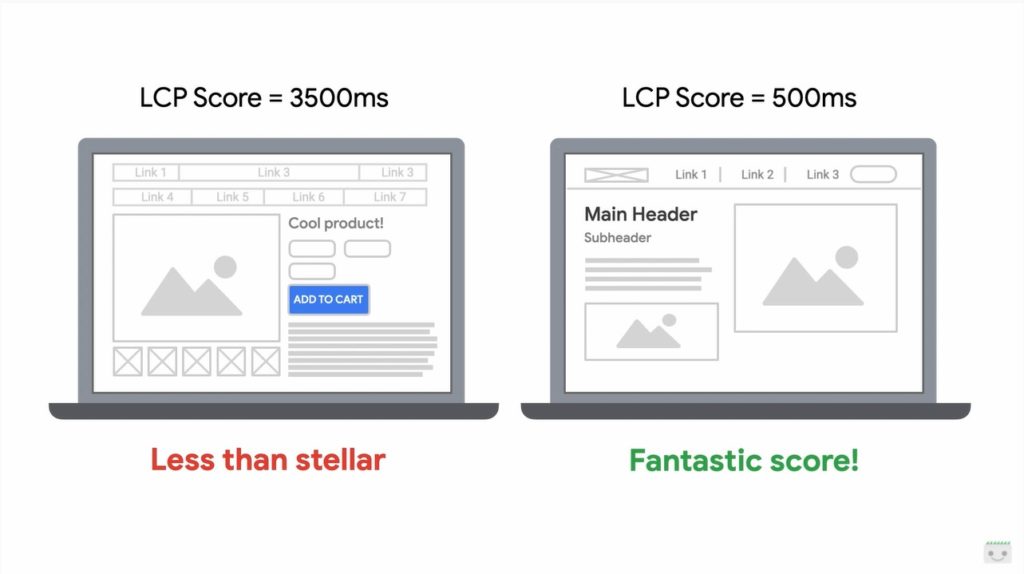
In short, contentful paint is a paint event that paints content, while the largest contentful paint “is when the element that uses as many pixels of all elements on the user’s screen is painted”.
How to measure the Largest Contentful Paint
The LCP value is measured in seconds and indicates precisely the interval between “the first bite that is loaded from the page and the final event of largest contentful paint”; as soon as our users touch, tap or interact with our page that time window closes and LCP stops being measured.
Whatever element took the highest number of seconds between the first byte and when it was painted is what is reported for the LCP for that URL; like any other part of the Page Experience, each page of the website has its own LCP score.
What are the good values of LCP
As for the FID, even in this case the score of one page does not influence that of another, and therefore “the home page may have a low LCP, but the product pages or articles could have fantastic results”.
It is important to remember that all these results “are generated and collected by the people who use the site, so if we see that the page has an LCP of a second, this is what real world users see when they visit the site”. Also, this metric is just “a part of the page experience, which in turn is just one of the many inputs that the Quest has within its secret sauce“, the Googler ironically says.
However, from a practical point of view, the goal is to ensure that the LCP is loaded in less than 2.5 seconds for at least 75 of the sessions on the page. This is what discriminates between pages that offer a good or bad LCP value, although the number only serves as a reference to “compare similar sites to understand on which users can have a better experience”Because there’s no real threshold for overcoming or failing.
To explain this concept, Kettner makes an example: if we were faced with two identical pages in every aspect, one of which takes twice as long to render and paint content, we would undoubtedly prefer to use the fastest one.
How to calculate the Largest Contentful Paint
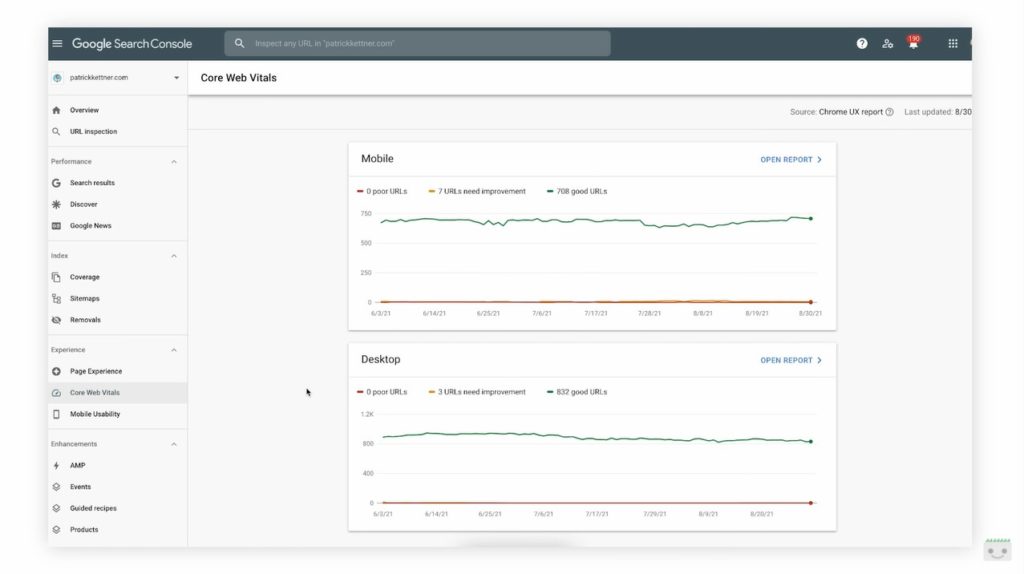
To simplify the operations of calculation and tracking of the LCP we have the Experience Report on the pages of the Search Console, which provides data on all the Core Web Vitals and on the Page Experience.
The report intuitively reports if the property Urls are below the 2.5 seconds target of loading through green graphs; the red lines indicate that pages have a slower loading, and if we see yellow tracks instead, it means that some URLs need to be improved.
A system to immediately discover the scores and their motivations are the “developer tools” in the browser, activating the overlay of core web vitals and loading the URL. In this way, admits Kettner, we also see the “first potential problem of LCP results”, that the data shown here are much faster than those of the Search Console.
However, it is good to know and remember that the only LCP score that really matters is that in the experience report on the pages, because the search algorithm will use that same information for its evaluations. This is in fact the value that comes from our real users: so, if we see a discrepancy between the data within our GSC report and that when we view the site, We may need to tweak the development configuration a bit to better align the score that is recorded; in fact, we could work on a powerful development machine while our users reach the site on five-year-old phones.
For this reason, ideally when we work on the page experience, and especially for the parameters of the Vitals Core Web, we should test the values by simulating devices that are the same, or at least are similar, to those of most of our users (information that can be derived from the analytics of the site). You don’t need to know the exact model of the device, but just have an understanding of what is the most common experience for people interested in that page of our site (for example if they are using a high-end or low-end device, an older or newer browser, what are the size of their screen etc.). If we don’t have other tools available, chrome devtools allows us to set up emulation of mid-range or low-end mobile devices, to get closer to those of real users.
The use of the PerformanceObserver API
When our LCP report gets closer to what is actually in the report, the Googler continues, we can use the PerformanceObserver API to get more detailed information about this LCP event, as what precise element is taking that time to be painted.
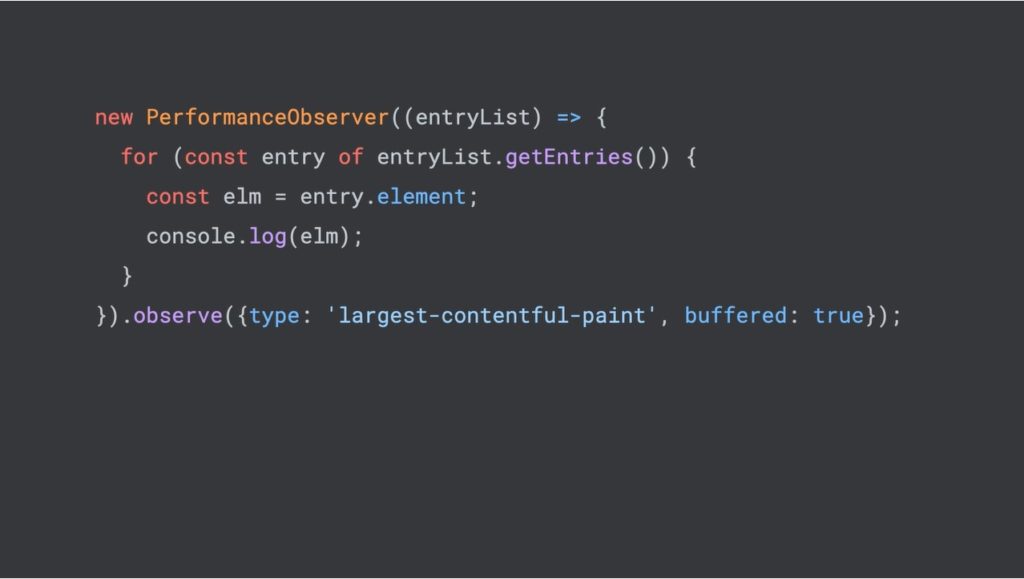
Looking at the type of largest contentful paint we can repeat on each LCP entry, to directly check the element attribute for each entry: this will give us the actual live dom node that triggers the LCP event, which could be any of the dom types, as images, videos or even just text. ” Even web fonts can actually inflate the LCP and it is definitely an aspect to pay attention to”, Kettner suggests.
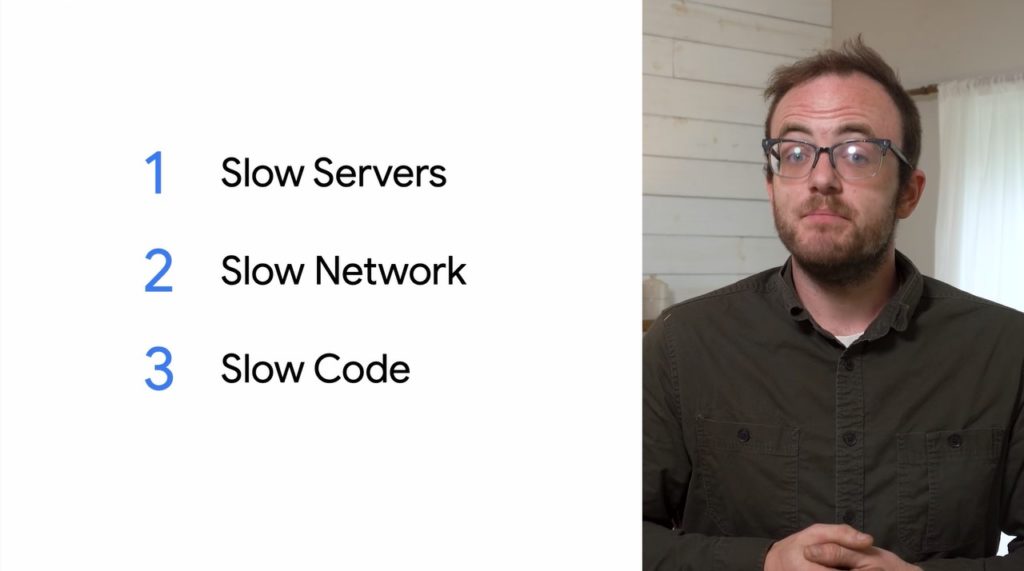
The three main problems with LCP
All the problems with a slowdown of the Largest Contentful Paint can be reduced to three categories:
- Slow servers
- Slow Network
- Slow code
How to face and solve slow server issues
The LCP measures “from the first byte the browser receives until our users interact with the page”: so, if our server is slow or simply not fully optimized, we are inflating our LCP even before you have a chance to start loading our browser code.
Server optimization is a very broad topic, but to begin with we can also limit ourselves to reducing server logic and operations to what is really essential; ensure that the CMS or whatever the back end is caching pages rather than rebuilding them at each request; verify that static files (such as images, stylesheets and scripts) are served with long-lived header caching to reduce the number of files the server has to send over and over.
How to address and fix Network issues
After we have verified that the servers are in optimal working conditions, we can go on to optimize the next aspect, namely the Network.
“Even if our server is powered by a turbo and our front end offers maximum performance, if our network is slow it will compromise all that work,” explains Kettner, who calls it essential to use a CDN or content delivery network, that we know are services that allow us to serve copies of the content of our server on their servers.
For a practical example, if our server is in San Francisco but the user is in Lagos, instead of passing each file through oceans and continents for each individual it is more convenient and performing to use a cdn, which will copy those files and store them in a geographically located server much closer to the end user.
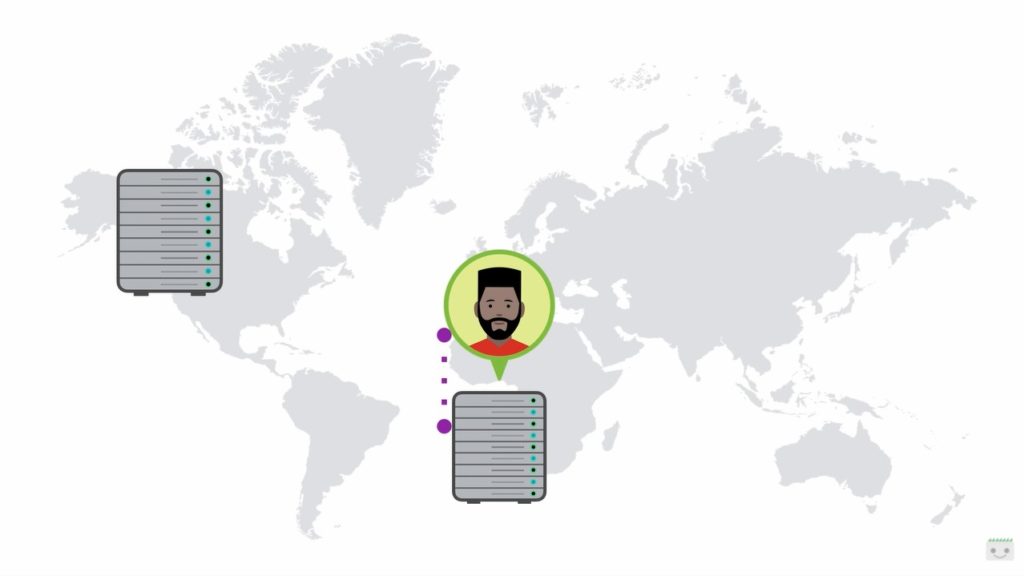
Less distance “means less time spent on the wire, so files load faster by lowering our LCP,” summarizes the Google Developer Advocate.
Of course, the fastest way to meet a network request is “never leave the user’s device, so using a service worker is a great choice to instantly load our sites”. In summary, service workers are special javascript files that allow you to intercept and respond to network requests directly within the browser, and seem to give excellent feedback (even) in lowering the value of LCP.
How to address and solve problems with the front-end code
We “learned that LCP only measures what is on the user’s screen and stops being reported after there is interaction with the page”: this means that the element that triggers our Largest Contentful Paint “will probably be in that initial area shown at the top of our page when the Urç is first loaded”, which we will call the initial viewport.
Our job is to make sure that whatever is rendered in that initial viewport is able to do it as quickly as possible, with various interventions.
The first thing we can do is to “remove stuff“, delete any scripts and style sheets in the head of our document that are not used on this page and that can block or slow down the browser while rendering what is actually used – they are “devouring our crucial LCP budget”.
Going further in this intervention, instead of connecting separate files we can directly add essential css and javascript to the initial viewport right inside the head: thus, the browser does not have to “find our css, download it, analyze it and then layout the page, but simply jump directly to the layout in the millisecond that comes to us”, so as to optimize a little more the loading performance of each individual page.
The use of async and defer attributes
If we still use scripts on the page, we can use defer and async, two attributes that we can add to any script tag and that act a bit like signals that we can give the browser about the different ways it can speed up its rendering. Kettner explains that “a browser can only do one thing at a time, and by default it will go from the beginning to the end of our code by downloading and analyzing everything more or less one line at a time”.
Adding the async attribute to our script tag, we tell the browser that “we won’t rely on any other resource on the page, which can download the other stuff in the background and run it as soon as it has finished downloading”: if the script is important for the site and needs to be executed as soon as possible, the async attribute is an excellent option, second only to the injection of the script into the head.
If the script “must be on the page, but it can wait a bit” we can use the defer attribute. Scripts that use async can stop the browser from rendering other parts of the dom, because they run them in the second they’ve finished downloading; defer “is more polite” because it tells the browser that it can download and process other things on the page, but will not interrupt the browser to be executed, because it waits for the page to have been completely analyzed (parsed).
The defer attribute is a good solution “for anything that is not critical to our initial viewport, such as libraries, video player or widgets used further down on the page”; removing extra network downloads is fine “but it’s not always practical, because some remote resources, such as images or web fonts, cannot be inserted online without really inflating the size of our file,” Kettner clarifies.
The use of prefetch dns, preconnect dns and preload metadata
If some of our resources are hosted on other domains, such as a cdn, we can speed up the work that the browser has to do by adding prefetch dns or preload metadata to our page, two other tips that we can share with the browser for “let him do more work at the same time”.
DNS prefetch is a signal “that says I will need to download content from this domain in the future: it may seem a bit silly, but it can actually help quite a bit depending on how our site is structured”.
It’s good to remember that browsers don’t know “how to get to every single website in the world, and when they look for something new they use a system called DNS“: normally, when the browser processes our code it discovers a URL of something we want to download; They will then use DNS to understand the IP address of the server of that site and then figure out how to reach it on the Internet. Although this process is normally quite fast, it still takes time and “maybe even dozens of trips across space or around the world”: using prefetch dns we tell the browser to do all that work in the background while processing the page, so that by the time we get to that url in the code the dns have already been resolved, making our site even faster.
This is not the only job to do: if we are following best practices and loading only content to HTTPS, the browser must start what is called a handshake to the server before the bytes can be downloaded from it. This handshake happens when some messages are passed back and forth from the browser to the server and vice versa to make sure any communication that happens between them. Just like DNS, it happens incredibly quickly, but we can make it even faster by simply adding a preconnect statement (a preconnect statement) to our page.
Just like prefetch dns, this lets the server know that “it’s okay to do that work in the background and that as a result “we can kind of skip it once we get there in the code”.
Paralleling these network tasks is particularly useful on slow networks or less powerful devices, two situations that can easily cause our LCP to take longer than the 2.5 second target. When we have remote content in the initial viewport, the prefetch dns and preconnect can cut even more milliseconds from our value.
A third method is that of preload, “another piece of metadata that tells the browser that we can actually download and analyze the content, and that therefore will be much more challenging in terms of resources”. We can use preload on scripts, stylesheets, images, videos, web fonts, and thus on virtually anything that can trigger an LCP event; however, using preload on too many things can bog down the browser, making it work worse than it does without the attribute, and therefore we must limit it only to content that is extremely important, such as “things in our initial viewport”.
LCP and images, Google’s tips to avoid overloading
According to Kettner, “the most common cause of a bad LCP are images“, which typically make up almost half of the bytes of a desktop or mobile media page”.
Without going into too much detail about image optimization tips, the Googler however reminds us of some basic best practices to follow:
- Use efficient images, that is, do not send images that are much larger than they actually need to be displayed and compressed as much as possible. Some tools (the video specifically mentions Squoosh) can actually automatically compress images and control visual degradation, allowing us to get the smallest possible version of the image. Every byte saved on our initial viewport allows our LCP to take place much faster.
- Add the loading=lazy attribute to images that are not in the initial viewport, to signal to the browser that we can delay loading these images because they are less likely to be seen right away. This allows us to free other resources for more critical content, but we must be sure not to use the attribute on content that is in the initial viewport, which otherwise would lose priority by generating a negative impact on our LCP.
- Use image formats “browsers and servers do a content negotiation: in practice, every time a browser sends a request to a server it also tells the server the type of content it supports, and this is really useful because we can use it to know if our users’ browsers can support things like webp or avif“, modern image formats that we can use to reduce the weight of images by up to 90% compared to traditional jpegs. So, when the user’s browser is analyzing our code and finding an image, it sends a request to our CDN or server to download that image and also informs about the support of file formats such as webp or avif; on the server, we can check this information and, instead of responding with jpeg or png files served to other browsers, we can offer a modern smaller file format, which however can have a gigantic impact on our LCP. According to Kettner, it can cut two-digit percentages from the bytes you need to download from our site.
Pills for the comprehension of LCP
The last part of the video is dedicated to the list of some final clarifications that result from the exploration of the Largest Contentful Paint.
First, Kettner points out that LCP does not take into account the largest element on the user’s screen, but the element with the largest number of visible pixels: therefore, if we have for example a gigantic element that is cropped or whose opacity has been sent to zero, those invisible pixels are not counted in its size.
Secondly, to avoid damaging the performance of the browser when we control our performance, LCP only looks at the initial location and size of an item: it can still be counted if it is rendered on the screen and then moved, and similarly if it is rendered off the screen and then animated on the screen it will not be counted by LCP.
Still: As the Largest Contentful Paint “is what our users are actually seeing“, we may get some unusually bad LCP scores if a page is loaded into the background window or tab. These pages are loaded much slower and with lower priority than the tabs in the foreground, so in case of doubt it is better to look for pattern analytics that can explain some strange results.
Fourth edgecase reported by Kettner regards the weight that (still) iframes have: because of the web security model and at least by default, you can not get LCP information from an iframe on the page, but as for the involvement of the browser that content still has an impact on the LCP value of our URL. So, by monitoring the LCP through Performanceobserver we may actually lose the LCP events that are reported by the browser, but we can avoid that by adding cores to the iframes and making sure that they report their values to the parent iframe. Or, a simpler and clearer solution, it is better to limit the iframes and keep them out of the initial viewport because they “only cause headaches”.
The fifth case makes it clear that Performanceobserver does not issue events when you get to the page from the browser’s back or forward buttons, because those pages are cached in the browser and, therefore, the same events in the pipeline are not executed. However, the browser still reports LCP information for those situations since for the user it is still a page view.
The last super important tip concerns a trick to preview our LCP scores: we know that the canonical information is updated and made official only every 28 days (as well as all the Page Experience data) but we can keep track of the daily trend using our analytics and Observerperformance code. For example, with Google Analytics we can create a custom event and add LCP information every time a visitor arrives on our page. In this way, we will have “LCP results updated per minute with which to monitor any improvement we are working on, instead of waiting a full month to know if we have even just moved the needle”.