Interaction to Next Paint or INP, new Google’s Core Web Vital
An improved metric for website page interactivity and adaptability, or the speed and fluidity with which our pages load and respond to user interactions. We are talking about INP or Interaction to Next Paint, which as of March 12, 2024 will become the official metric of Google’s Core Web Vitals to measure responsiveness, replacing FID. This means, therefore, that developers and site owners need to pay even more attention to their site’s performance and take steps to optimize areas that affect interactivity.So here is our complete guide to INP, explaining what this value is, what it measures, and what we can actually do to improve our sites’ responsiveness.
INP Interaction to Next Paint: the new metric for responsiveness
An acronym for Interaction to Next Paint, INP is a metric that assesses the overall adaptability of a page to user interactions by looking at the latency of all click, touch, and keyboard interactions that occur during the duration of a user’s visit to a page. The final INP value corresponds to the longest interaction observed, ignoring outliers.
In simpler terms, INP measures the time between a user interaction, such as a click or keystroke, and the point at which the browser is able to respond by displaying the result of that interaction. This time interval is crucial: any delay can in fact frustrate the user and negatively affect his or her perception of the site.
The practical goal of INP is to ensure that the time from when a user initiates an interaction until the next frame is drawn is as short as possible. A low INP means that the page has consistently been able to respond quickly to all or nearly all user interactions.
It is important to note that INP observes the latency of all interactions a user has made with the page, reporting a single value below which all (or nearly all) interactions have been made-this is a relevant difference with FID, which instead reports only the responsiveness of the first time a user interacts with the page.
What Interaction to Next Paint Means
The Interaction to Next Paint metric measures the moment when a user interacts with a page (e.g., clicking a button) and the moment when the browser can display changed pixels on the screen. This indicator is distinguished by its ability to capture the essence of a site’s interactivity, going beyond simple loading speed: because of its characteristics, it takes into account the complexity and variability of human interactions, providing developers with a more accurate tool for evaluating and optimizing the experience provided by site pages.
This is fully in line with the goals of the Core Web Vitals program, which is the set of specific metrics aimed at evaluating the quality of the user experience on a web page. These indicators were selected and introduced by Google to measure critical dimensions of the user experience-loading, visual stability, and precisely interactivity-with the intent of providing objective and unified metrics to evaluate the performance of a website from the end user’s point of view, and which are thus essential to the overall health of a web page.
Your ally to succeed on Google


Google knows that a responsive, fast, and fluid site to every request/interaction not only satisfies users (and does not frustrate or annoy them), but also invites them to stay longer, explore more content, and ultimately take important actions such as purchases or sign-ups.
First Input Delay, however, had already shown limitations, so a different and more useful measurement was needed: INP (Italian for interaction until the next view) goes precisely in this direction, recording the latency of all interactions throughout the entire page lifecycle and capturing aspects of interactivity that FID failed to understand. As mentioned, the page’s INP is recorded as the highest value of these interactions or the value closest to the highest for pages with many interactions, and a low INP value ensures that the page is always reliably responsive.
It is therefore a full-page lifecycle metric, just like Cumulative Layout Shift, and therefore measures all interactions, not just the first one, changing and updating continuously throughout the entire lifecycle of the page; also, as in the case of CLS, an INP value is not recorded until the user leaves the page.
INP is also referred to as runtime responsiveness to differentiate it from simple loading responsiveness, and in practical terms it measures the entire input latency from when a user interacts until he or she actually sees a visual response, not just the initial delay on the main thread.
What is responsiveness and why is it important for a site
Introducing the value of INP was an article by Jeremy Wagner on blog.dev, which also delves into the meaning of responsiveness, a value that estimates how quickly a page responds to user input and is critical to people’s positive interaction with pages.
Chrome usage data show that about 90 percent of the time a user spends on a page is precisely spent after the page loads: therefore, careful measurement of responsiveness is important, especially as more and more websites rely on JavaScript to provide interactivity, and INP measures this by understanding as mentioned the entire lifecycle of a page.
When responsiveness is good, pages respond quickly to user interactions: when an application responds to interactions, the resulting changes in the user interface are visual feedback that “tells us, for example, whether an item we asked to add to a site’s shopping cart is actually added, whether the contents of a login form are authenticated by the server, whether a mobile menu has opened, and so on.”
Some interactions naturally take longer than others, but for particularly complex interactions it is important to quickly present initial visual feedback that signals to the user that “something is happening.” The time until the next paint is the first opportunity to do this. Therefore, the intent of INP is not to measure all possible effects of the interaction (such as network fetches and UI updates from other asynchronous operations), but the time until the next paint is blocked. By delaying visual feedback, we may give users the impression that the page is not responding to their actions.
The practical goal of INP is to ensure that the time from when a user initiates an interaction until the next frame is drawn is as short as possible, for all or most of the interactions made by the user.
The video clarifies these issues, showing a visual representation of poor and good responsiveness: on the left, long tasks block the accordion from opening, which causes the user to click several times, thinking the experience is interrupted. When the main thread catches up, it also processes delayed input, causing the accordion menu to open and close unexpectedly.
The definition of INP and the value of the metric
Wagner’s original article explained in detail how INP works and how to measure it, and also offered a number of initial suggestions for improving the value, starting with the assumption that good responsiveness is essential to ensure a good user experience-the technical optimization aspect of INP was then further explored in a subsequent in-depth discussion.
Picking up on the definition, Interaction to Next Paint is a metric that aims to represent the overall latency of a page’s interactions by selecting one of the longest individual interactions that occur when a user visits a page.
For pages with less than 50 total interactions, INP is the interaction with the worst latency; for pages with many interactions, INP is often the 98th percentile of interaction latency.
As of today (2023), Google has since told us, 93 percent of sites have good FID performance on mobile devices, but only 65 percent of sites have good INP on mobile devices.Since, as mentioned, INP paints a much more accurate picture of responsiveness, these numbers help us see more clearly the room for improvement ahead.
How INP is measured
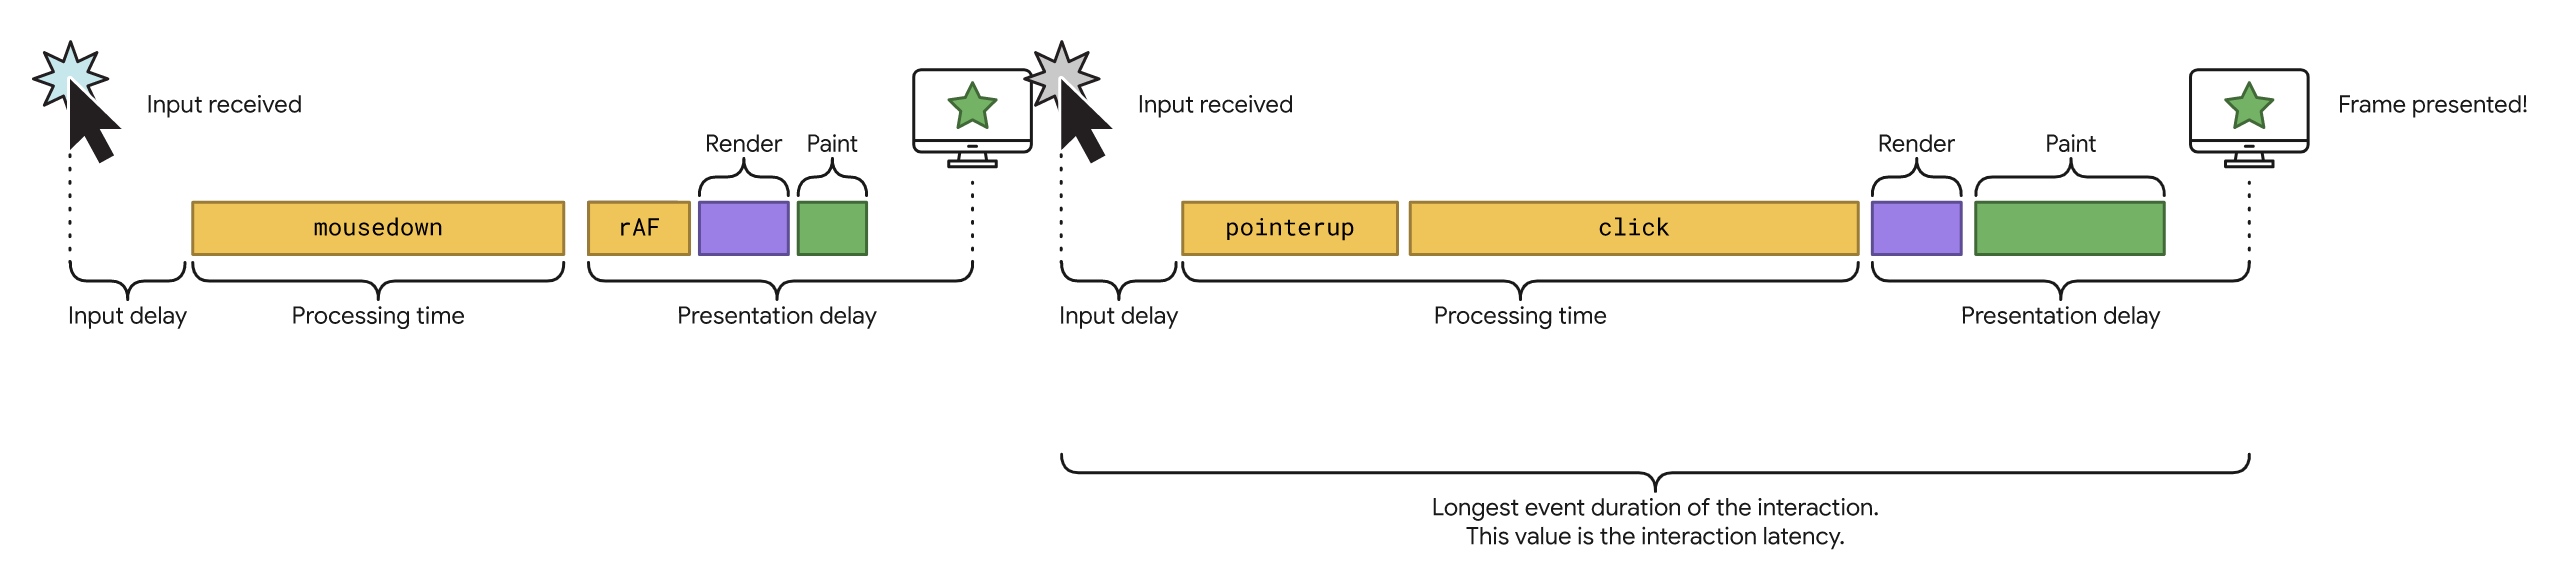
Going back to the basic definitions, an interaction is a set of related input events that are triggered during the same logical user gesture: for example, “tap” interactions on a touchscreen device include multiple events, such as raising the pointer, lowering the pointer, and clicking, that can contribute to the overall latency of the interaction.
The latency of a single interaction consists of the longest duration of each event that is part of the interaction, where the duration is measured from the time the user interacted with the page until the next frame is presented after all associated event handlers have been executed.
The duration is the sum of the following times:
- The input delay, which is the time between the moment the user interacts with the page and the execution of the event handlers.
- The processing time, which is the total time required to execute the code in the associated event handlers.
- The presentation delay, which is the time between the end of the execution of the event handlers and the presentation of the next frame by the browser.
In general, a low INP means that the page has consistently been able to respond quickly to all, or the vast majority, of user interactions.
Calculating INP: what are the optimal values
According to Wagner, ascribing labels such as “good” or “poor” to a responsiveness metric is difficult: on the one hand, Google wants to encourage the development of user experiences that offer good responsiveness, but on the other hand, it is necessary to take into account the fact that there is considerable variability in the capabilities of the devices people use, and accordingly set expectations that are truly achievable by selecting a goal that is not impossible to achieve on low-end devices.
In light of this, it is important that the responsiveness metric is appropriate for a wide variety of use cases, and to be certain of achieving this goal, a good threshold to measure is the 75th percentile of page loads recorded in the field, segmented between mobile and desktop devices:
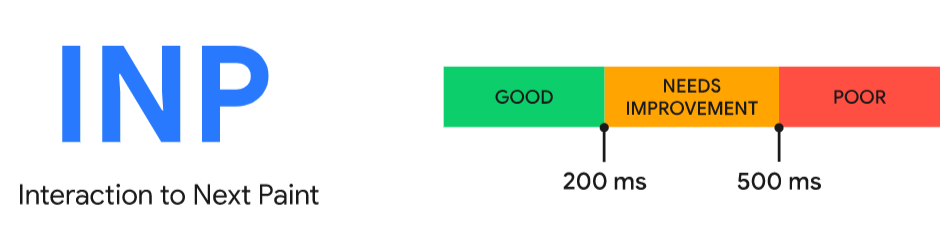
- An INP value of 200 milliseconds or less means the page has good responsiveness.
- An INP greater than 200 milliseconds and less than or equal to 500 milliseconds means that the page responsiveness needs improvement.
- An INP greater than 500 milliseconds means that page responsiveness is poor.
However, since INP is an experimental metric, threshold indications may change over time as the metric is fine-tuned, warns the article.
What’s in an interaction?
It also becomes useful at this point to understand what is meant by an interaction, and Wagner dwells particularly on this aspect.
When interacting with a page, the engine of interactivity is often JavaScript, although browsers also provide interactivity through controls not handled by JavaScript, such as check boxes, radio buttons, the HTML <details> element, and so on.
As for Interaction to Next Paint, an interaction consists of one of the following actions:
- Click the mouse on an interactive element.
- Touching an interactive element on a touchscreen-equipped device.
- Pressing a key on a physical or on-screen keyboard.
An interaction can be composed of multiple events-for example, a key press is composed of the keydown and keyup events (uppercase/lowercase or other characters reachable by the same key), and touch interactions contain the pointerup and pointerdown events (raising and lowering the pointer)-and all the events of an interaction are part of a so-called logical user interaction (logical user interaction).
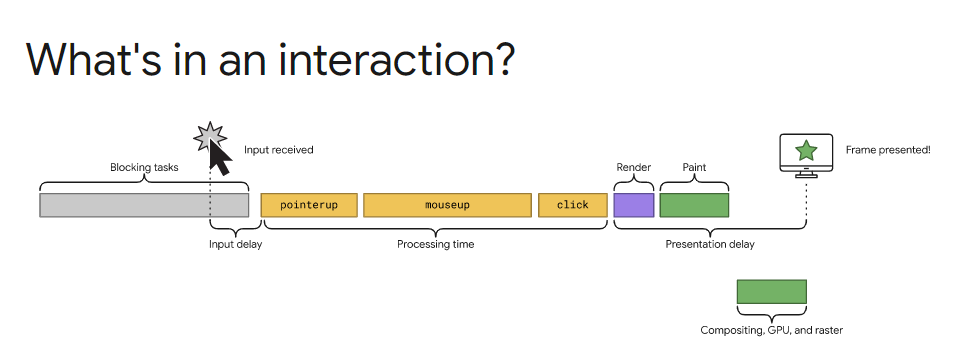
Each interaction consists of three phases: input delay, processing time, and presentation delay, and the image above shows the phases of a single interaction. The input delay occurs from the time an input is received and can be caused by factors such as blocking activities on the main thread. Processing time is the time it takes for the interaction’s event handlers to execute. At the end of execution there is the presentation delay, which is the time it takes to render and paint the next frame.
The duration of callbacks of events associated with an interaction is the sum of the times of the three phases; the event with the longest duration in the logical user interaction is recorded.
Similar to CLS, the INP is calculated when the user leaves the page, resulting in a single value that is representative of the overall responsiveness of the page over the entire page lifecycle. If the page responds quickly to high percentile interactions, it means that interactions at all lower percentiles are also fast.
What happens if there are no interactions
In some cases, the page loads, but no user interactions occur. This can happen for several reasons:
- It is possible that a user loaded the page, but got distracted and never used it.
- The user loaded the page, scrolled through it (this is not an interaction that INP takes into account), but never clicked, tapped, or pressed a key on the keyboard. Perhaps the useful part of the page that the user was looking for required no interaction to reach.
- The page was visited by a bot (e.g., a search crawler or headless browser) that was not programmed to interact with the page.
In all these cases, no INP value will be reported.
Why INP does not evaluate the worst interaction latency
We might ask, at this point, why Google chose to measure Interaction to Next Paint by taking “one of the longest individual interactions” and not the worst interaction latency.
Wagner responds that worst interaction might be appropriate “for pages with a relatively low number of interactions,” but not all web pages are the same and “some require more interactivity than others, such as a text editor or a video game application than a blog or news site.” For pages with a very high number of interactions, in particular, sampling the worst could be misleading, and even on websites that prioritize responsiveness occasional hiccups occur, and these interactions should be overlooked.
In contrast, by focusing on a high percentile, but not always the highest, it is possible to properly assess whether the majority of a page’s interactions receive a timely response.
How to measure INP: tools and techniques for calculating responsiveness
Instead, it is Wagner’s article again that goes into the technical details of how to measure Interaction to Next Paint on a site’s pages, while also offering useful practical tips for correcting situations where the values are not optimal.
First, INP can be measured either in the field or in the lab (with some effort) through a variety of instruments.
Among the field tools are:
- PageSpeed Insights.
- Chrome User Experience Report (CrUX).
– via BigQuery in the experimental.interaction_to_next_paint table of the CrUX dataset.
– CrUX API via experimental_interaction_to_next_paint.
– CrUX dashboard. - Web-vitals JavaScript library.
Wagner cautions, however, that currently collecting INP metrics in the field only works on browsers that fully support the Event Timing API, including the interactionId property.
Among the lab tools instead, we can use:
- Lighthouse panel in DevTools, available in “Timespan Mode.”
- Lighthouse npm module.
- Lighthouse user flows (user flow).
- Web Vitals extension for Chrome.
Then there is another option, which is to measure Interaction to Newt Paint in JavaScript, either by writing your own PerformanceObserver (but this can be difficult, Google warns) or by using the web-vitals JavaScript library, which exports an onINP function to do this work.
In fact, the developer suggests that the easiest way to see how our site responds to INP is to use PageSpeed Insights, which shows data from the Chrome User Experience Report (CrUX)-which is generally a potential source of field data for the site-or to use a Real User Monitoring (RUM) provider, which also observes the performance of the website in the field.
How to improve the INP value
If our website reports unsatisfactory and insufficient INP values-that in the fall under the category “needs improvement” or “poor”-we can obviously make some interventions to try to improve performance and thus responsiveness.
The first step is to learn how to diagnose and resolve INP problems: usually, high INP values indicate a high dependency on JavaScript or other non-JavaScript main threads that may be running concurrently with user interactions.
Our work (or the work of the developer we will involve in this analysis) should focus at this stage on finding slow interactions in the field and/or manually diagnosing slow interactions in the lab. Once we have identified what the problem is, we can follow guidelines to figure out for which parts of the interaction we should precisely optimize.
The fixes start with identifying the critical time for responsiveness, i.e., whether during page startup or later. The Google document reports five major areas to monitor to avoid problems with INP:
- Optimize long tasks if we have JavaScript that takes a lot of time in the main thread. If we encounter a lot of main thread activity during page loading that starts a lot of long tasks on the main thread, we may experience problems with too many script evaluation tasks.
- Optimize input delay, if the start of interaction processing takes a long time.
- Study large DOMs: they may require a lot of rendering work, and interactions often modify the DOM. It is best to avoid large, complex layouts and thrashing layouts and minimize the size of the DOM wherever possible.
- Any complex CSS selectors can also cause considerable work in response to user interactions.
- If the site renders much of the HTML code on the client via JavaScript, it is important to know how client-side HTML rendering may affect interactivity .
How to improve INP during page startup
INP can be a factor during page load, because users may attempt to interact with a page while it is retrieving JavaScript to set up event handlers that provide the interactivity needed for operation.
According to HTTP Archive, Total Blocking Time (TBT) correlates twice as well with INP as it does with FID. TBT is a laboratory metric, but if high TBT values are observed in laboratory instruments “it could be a sign of higher INP values” in the field as well.
To improve responsiveness during page loading, we can examine the following solutions:
- Remove unused code using the coverage tool in Chrome’s DevTools.
- Find opportunities to split the code, so that we can lazy load unnecessary JavaScript while the page is loading (still using the coverage tool to get information).
- Identify slow third-party JavaScript that might load during startup.
- Use the performance profiler to find long tasks that can be optimized.
- Verify not to require excessive browser rendering after the JavaScript code has been completed: for example, re-rendering a large component tree, decoding large images, too many heavy css effects, and so on.
Improving INP after page startup
But a page’s Interaction to Next Paint can also be affected by what happens after the page is started, because the metrics are calculated as mentioned based on inputs sampled throughout the page’s lifecycle.
When this happens, we can examine some areas for solutions:
- Use the postTask API to prioritize appropriately.
- Schedule non-essential work when the browser is idle with requestIdleCallback.
- Use the performance profiler to evaluate discrete interactions (e.g., activating a mobile navigation menu) and find long tasks to optimize.
- Check third-party JavaScript execution in the website to see if it affects page responsiveness.
INP and JavaScript: the critical points and possible optimizations
It is already clear from what has been written, therefore, that JavaScript has an obvious bearing on the responsiveness of a page, and indeed it can be assumed (without too much fear of contradiction) that any script that blocks the main thread for a long duration is bad for INP, also in light of the aforementioned correlation between INP values in the field and the total blocking time (TBT) observed in the laboratory.
Therefore, heavy JavaScript execution after an interaction could block the main thread for an extended period and delay the response to the interaction, and the developers’ article reveals some of the common causes that lead to script blocking, with some quick corrective actions we can apply.
- Unoptimized JavaScript. Redundant code or poor code splitting and loading strategies can cause JavaScript code to swell and block the main thread for long periods. Code splitting, progressive loading, and long task splitting can greatly improve response times.
- Third-party scripts. Third-party scripts, which are sometimes not needed to process an interaction (e.g., advertising scripts), can block the main thread and cause unnecessary delays. Prioritizing essential scripts can help reduce the negative impact of third-party scripts.
- Multiple event handlers. Multiple event handlers associated with each interaction, each running a different script, can interfere with each other and cause long delays. Some of these activities may be nonessential and may be scheduled on a web worker or when the browser is idle.
- Framework overheads on event handling. Frameworks may have additional features/syntaxes for event handling. For example, Vue uses v-on to attach event listeners to elements, while Angular deals with user event handlers. Implementing these features requires additional framework code to the standard JavaScript.
- Hydration. When using a JavaScript framework, it is not uncommon for a server to generate the initial HTML of a page, which then must be completed with event handlers and application state so that it can be interactive in a Web browser. This process is called hydration. It can be a heavy process during loading, depending on how long it takes JavaScript to load and finish hydration. It can also make pages look interactive that are not. Often hydration occurs automatically during page load or in lazy load (e.g., based on user interaction) and can impact INP or processing time due to task scheduling. In libraries such as React, it is possible to exploit useTransition so that part of the rendering of a component occurs in the next frame and the more “resource-costly” side effects are left to later frames. For this reason, updates in a transition that relate to more urgent updates, such as clicks, can be a useful pattern for INP.
- Prefetching. aggressive prefetching of the resources needed for subsequent navigations can be a performance benefit, if done well. However, if you prefetching and rendering SPA paths synchronously, you can end up having a negative impact on INP as all this expensive rendering tries to be completed in a single frame. This is the case when you do not prefetch the path and start the necessary work (e.g., fetch() ) and unlock the display. It is therefore worth reviewing whether the framework’s approach to prefetching provides an optimal UX and how (if at all) this may affect INP.
Ultimately, then, to achieve a good INP score, developers will need to focus on reviewing the code that is executed after each interaction on the page and optimize chunking, re-hydration, loading strategies, and the size of each render() update for both first-party and third-party scripts.
The relationship between INP and FID: INP is more reliable
Since its introduction in 2022, INP immediately attracted the interest of the international SEO community, mainly because this new metric immediately seemed to collide with First Input Delay, representing almost an evolution of it. This was also confirmed by Mocny’s presentation at Google I/O 2022, in which the Developer for Chrome Speed Metrics and Core Web Vitals (!) admitted that “FID has some pretty big blind spots,” adding that “that’s why we are introducing a new experimental responsiveness metric, Interaction to Next Paint,” leaving open even then the possibility that INP would replace (or at least flank) FID within the essential web signals and in Page Experience signals.
Delving into the above from a practical point of view as well, the difference between INP and FID is obvious: First Input Delay takes into account only the first interaction and measures only the input delay, not the processing time of event handlers or the delay in the presentation of the next frame, while in contrast Interaction to Next Paint considers all interactions on the page.
Being a load responsiveness metric, FID applies basic logic that “if the first interaction with a page in the loading phase has little or no input delay, the page has made a good first impression.”
INP goes beyond this “first impression,” however, because it covers the full spectrum of interactions that can occur from the moment the page begins to load to the moment the user leaves the page. By sampling all interactions, it manages to assess responsiveness comprehensively, which “makes INP a more reliable indicator of responsiveness than FID,” Wagner summarizes.
The differences between INP and FID and the advantages of INP
Going into more detail are Leena Sohoni, Addy Osmani and Keen Yee Liau, who also in the pages of web.dev sign off on an interesting insight focusing on the relationship between INP metrics and the experience of sites built with JavaScript frameworks and libraries.
Discussing the differences between FID and INP, the three engineers point out that First Input Delay “measures the waiting time from the first user interaction to the time when the browser is able to process event handlers related to the interaction,” but does not include the time it takes to process event handlers, to process subsequent interactions on the same page, or to display the next frame after event callbacks are executed.
However, they note, responsiveness is critical to the user experience throughout the page lifecycle, since users spend about 90 percent of the time on a page after it loads. Moreover, since FID measures precisely only the input delay of the first interaction, it is likely that web developers have not proactively optimized subsequent interactions as part of their improvement process.
This is where INP comes in, which measures the time it takes for a web page to respond to user interactions, from when the user begins the interaction until the next frame appears on the screen. With this new metric, Google hopes “to obtain an aggregate measure of the perceived latency of all interactions in the page lifecycle,” a “more accurate estimate of the loading and execution responsiveness of web pages.”
FID vs. INP: features, calculation and optimizations
The article also presents a valuable summary and comparison table between the characteristics of First Input Delay and Interaction to Next Paint.
In general, INP tends to have lower pass rates, and the difference in the measurement process requires further optimization of the code. Specifically, the points to focus on are:
-
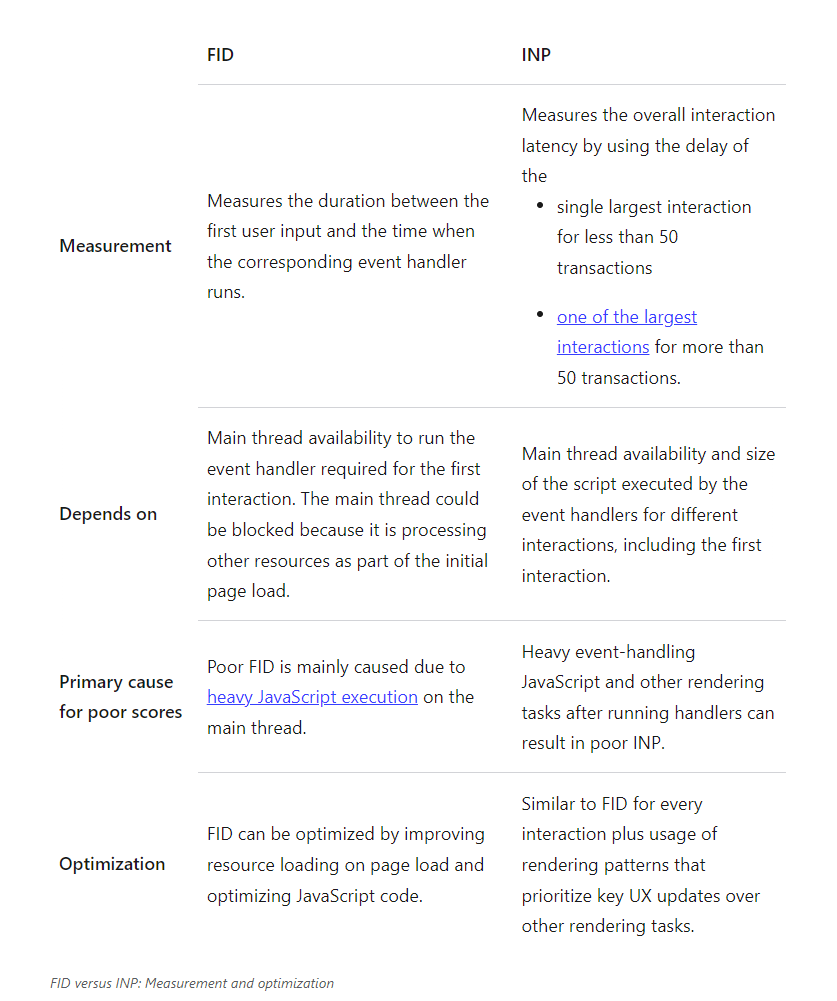
- Measurement
- FID measures the duration between the first user input and the time when the corresponding event handler is executed.
- INP measures the overall latency of the interaction using the delay
– of the single largest interaction for less than 50 transactions.
– of one of the largest interactions for more than 50 transactions.
2. What it depends on
- FID depends on the main thread’s readiness to run the event handler needed for the first interaction. The main thread may be blocked because it is processing other resources as part of the initial page load.
- INP depends on the availability of the main thread and the size of the script executed by the event handlers for several interactions, including the first interaction.
3. Primary cause of poor scores
- A poor FID depends primarily on heavy JavaScript execution on the main thread
- Heavy JavaScript event handling and other rendering activities after the execution of handlers can cause poor INP.
4. Optimization
- The FID can be optimized by improving resource loading at page load time and optimizing the JavaScript code.
- The optimization process is similar to that of FID for each interaction, but it also requires the use of rendering models that prioritize key UX updates over other rendering tasks.
Ultimately, Interaction to Next Paint is the best metric for measuring responsiveness
First Input Delay is “an excellent metric for measuring input responsiveness during page loading,” the Googlers say, and when it was added to Core Web Vitals in 2020 it represented “a huge step forward” from previous tools because it offered developers a new way to measure responsiveness the way real site users experience it. Unlike similar metrics that “only approximate page interactivity, such as Total Blocking Time (TBT) and Time To Interactive (TTI),” Viscomi and Sullivan specify, “FID directly measures user experience”-essentially, a page could have slow TBT or TTI and still be perceived as responsive because of the way real users interact with the page.
Although it has indeed improved the way we measure responsiveness, FID has not been without its limitations, and there is another aspect that has decreed its what we can call obsolescence: the Web continues to become faster and more capable, and users expect richer, more interactive interfaces, so looking only at responsiveness during page loading does not tell the whole story. A more holistic approach to measuring responsiveness was needed, and INP goes in that direction.
The name FID itself immediately reveals the first two limitations: “first input” and “delay.” FID reports only the responsiveness of the first time a user interacts with the page. Although first impressions are important, the first interaction is not necessarily representative of all interactions over the life of a page, the guide explains. In addition, FID only measures the input delay portion of the first interaction, which is the amount of time the browser had to wait (due to main thread occupancy) before even starting to handle the interaction.
All of this was analyzed and led to the introduction of INP, which, instead of measuring only the first interaction, takes into account all interactions, reporting one of the slowest in the entire page duration. And, instead of measuring only the lagging portion, INP measures the entire duration from the beginning of the interaction, through the event handler, and until the browser is able to draw the next frame-a process that clarifies the interaction name until the next display. These implementation details make INP a much more comprehensive measure of perceived user responsiveness than FID.
Ready to welcome Interaction to Next Paint
According to Googlers, the INP score is intended to be a “better compass for websites” to improve responsiveness and performance, establishing a new level in measuring page responsiveness as truly perceived by users.


Manage all SEO aspects
Credit also goes to the slow and careful development phase of this metric, which has now been talked about for more than two years and undergone extensive testing and feedback gathering from the community. It was in 2022 that INP was first presented in the aforementioned article by Jeremy Wagner, but attention has risen since the official announcement came during Google I/O 2022, with the talk by Annie Sullivan and Michal Mocny focusing precisely on the topic of responsiveness and the actions being taken by Google to strive for a general improvement of the web ecosystem on that front.
At the end of twelve months of testing and experimental use, during which time the metric was made widely available in Google’s tools with a lot of dialogue work with the community to verify its effectiveness, leading up in May 2023 to the news that was already glimpsed, namely that Interaction to Next Paint is poised to replace First Input Delay among Google’s Core Web Vitals, as explained by Rick Viscomi and Annie Sullivan.
With just over a month to go before the final transition and farewell to FID, developers should check whether their Web site’s INP meets the “good” threshold, which reflects performance at the 75th percentile of page loads. In fact, in recent months the international community has reacted with curiosity but no apparent frenzy to the news, partly in light of its experience with Page Experience and Core Web Vitals, which ultimately proved to be a ranking factor of little impact (at least perceived) despite lofty premises.
Regardless, we still need to remember (and know) that Google’s integration of INP as Core Web Vital could impact web development and user experience in several ways: first, Page Experience is one of the factors evaluated by Google’s ranking systems to influence Web sites’ search engine rankings. No less important is the aspect concerning user engagement, because web development practices may evolve to focus more on optimizing the availability of interaction, elements that may require changes to application architecture and code. On a day-to-day basis, then, performance monitoring tools and strategies may need to be updated to monitor and analyze (also) the new INP metrics.
Regarding the latter, Google reminded that as of March 12, 2024, INP will officially become a Core Web Vital and replace FID; as of this date, First Input Delay will no longer be a Core Web Vital and will be officially deprecated and removed from the program.
As a result, there will be changes in the FID documentation-which will remain in place to provide guidance on the metric and its optimization, but with appropriate reporting of the deprecated status of FID and references to the more current INP documentation (a path we will also follow on the blog). The same thing will happen for analytics and monitoring tools: FID will be removed from Google Search Console on March 12, and all other tools, such as PageSpeed Insights and CrUX, will offer a six-month deprecation period to give developers a chance to update their code.
What the introduction of INP among CWVs means for site owners and analytics tools
Martin Splitt, Developer Relations Engineer on the Google Search Relations team, also addressed the impact the Core Web Vitals revolution can have on Search Console reports and those working on site optimizations.
First, to help site owners and developers take the necessary steps and evaluate their pages for the new metrics, Search Console has added INP in the Core Web Vitals report as early as the end of 2023: as of March 12, the time of the final “replacement,” it will stop showing FID metrics and use only INP as a metric for responsiveness, in addition to Largest Contentful Paint (LCP) and Cumulative Layout Shift (CLS), which remain confirmed instead.
From an application standpoint, those who have already worked to improve the site in compliance with Core Web Vitals should have already considered page responsiveness, and, according to Splitt, the improvements made for FID are a good basis for improving INP and responsiveness. Achieving good Core Web Vitals can help succeed with search and ensure a great user experience overall, the Googler adds, but “a great page experience implies more than Core Web Vitals and good statistics within the Core Web Vitals report in Search Console or third-party Core Web Vitals reports do not guarantee good rankings.”
The provocation: it pays to redo sites from scratch
The introduction of INP among Core Web Vitals was also the focus of Ivano Di Biasi’s speech at Zoomday 2023 in Naples, where our CEO launched what was only on the surface an ironic provocation.
At first glance, the arrival of INP might seem like yet another technical complication to be dealt with, with lots of investment but few “practical” effects: yet, the reality is quite different, because this is yet another signal that Google is sending to web designers, developers and site owners. For years, before the advent of Core Web Vitals, the digital landscape was a breeding ground of convenience and ready-to-use tools without much concern about client-side impact.
That is, we saw the proliferation of solutions such as Bootstrap to simplify page layouts, jQuery to manipulate the Document Object Model (DOM) with extreme freedom, tons of WordPress plugins to meet every conceivable need, visual composers to facilitate Web page creation. And then, again, frameworks such as React JS and Vue, JavaScript libraries for particular user interfaces (UIs), and fonts of every style available for free-all of these used to be every developer’s daily allies.
Now, however, these resources, once blessings for any modern website, turn out to be major obstacles in optimizing performance and Core Web Vitals. The question arises: is it time to throw it all away and start from scratch?
The answer is as provocative as it is realistic: in order to address the problems permanently, it would be wise to roll up your sleeves and plan a complete website makeover, and it would be preferable to do so before next month, because acting early is the best strategy.
- Adopt a Mobile First approach: Google has been preaching this for years, yet many are still limited to responsive responsive solutions instead of proactive ones.
- Abandon Bootstrap for greater customization and control over performance.
- Eliminate jQuery by favoring native JavaScript, to be used only when strictly necessary.
- Minimize layout changes to avoid unexpected shifts in visual elements that can affect Cumulative Layout Shift (CLS).
- Prefer images in modern formats, such as webp or avif, to ensure quality and lightness.
- Limit the use of fonts, selecting one or two at most, embedded directly in the page to reduce external requests.
- Simplify HTML, avoiding complex structures that slow down rendering.
This might sound like a return to minimalism, but it is actually a strategic choice: a mobile-optimized website could be effectively built using mainly heading tags (H1, H2, etc.) and the DIV tag.
This approach would not only not disfigure on mobile, but could be just as effective on desktop.
Giving up frills is not a loss, but an investment in performance and, consequently, in the overall user experience.