Troubleshooting Core Web Vitals with Chrome Devtools
Let us talk once again about Core Web Vitals, the set of metrics introduced by Google a few years ago to provide a useful reference for site owners in identifying the most common (and annoying) challenges users might face while on the pages of our sites. Thanks to Martin Splitt, Developer Relations Engineer at Google Search, we work from a different perspective as we go to find out how to debug issues with these metrics directly in our browser, using Chrome Devtools.
How to debug Core Web Vitals in the Chrome browser
In the latest video in Search Central’s Lightning Talk series on YouTube, Splitt walks us through precisely how to take advantage of the tools already present in the Chrome browser to identify and analyze problems encountered with Core Web Vitals metrics so that we can speed up the troubleshooting work.
The premise to always remember is that Core Web Vitals are real user metrics, monitoring data from people using the website in the real world; however, for debugging purposes it can be useful to look at lab data, which can give us a rough idea of what might be causing problems. And the Chrome Developer tools allow us precisely to create and measure this data simply by using our everyday devices.
The first step: using Lighthouse to snapshot the situation
To start debugging, Splitt recommends opening the Developer Tools built into the browser tool and using the Lighthouse report in particular to get a first impression of the status quo of our site.

To do this, simply right-click on the Chrome tab where we have opened the page to be analyzed and click on “Inspect,” and then search for the “Lighthouse” tab among those present. As shown in the video, we immediately get a summary audit with the page’s performance, which we need precisely to have a starting point for subsequent evaluations.
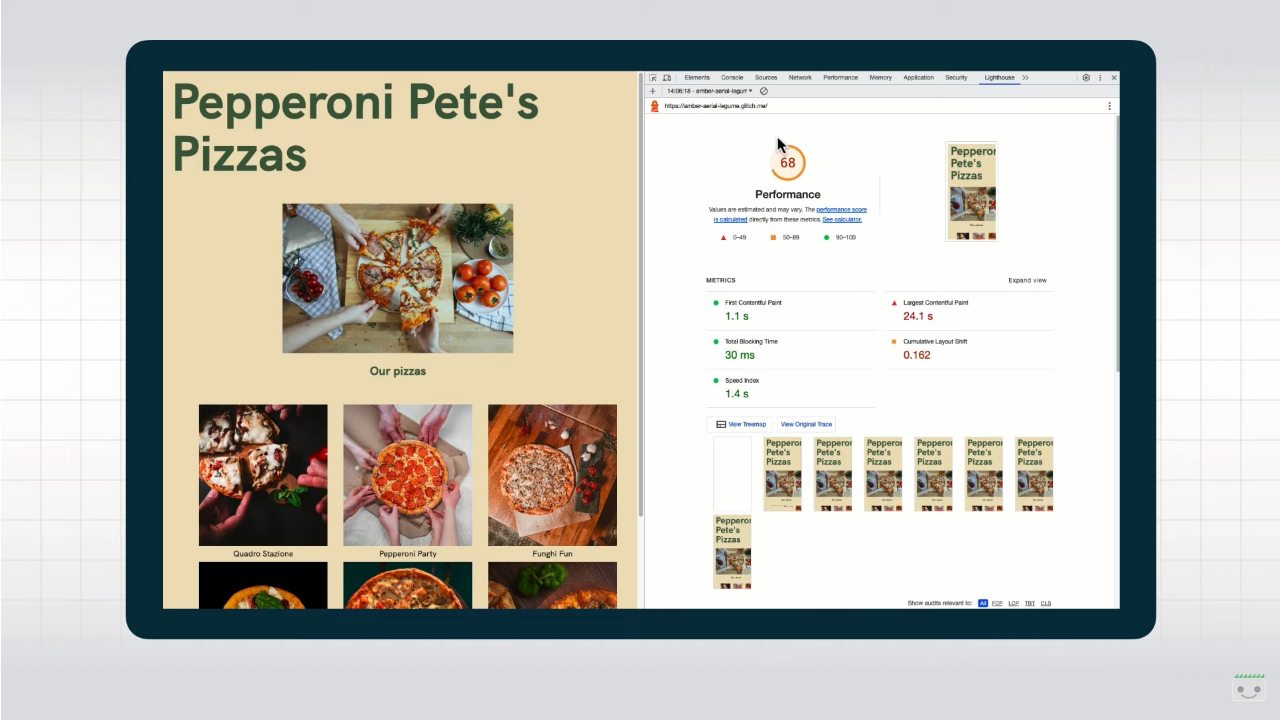
Returning to the previous premise, it should be kept in mind that reactivity metrics, FID or INP, are field metrics and, as such, cannot really be captured by Lighthouse measurements. Better, rather, to use the Total Blocking Time metric as a rough indicator.
As Splitt explains, Lighthouse usually shows a number of recommendations that can already help improve performance quite a bit, but it focuses on initial page load performance.
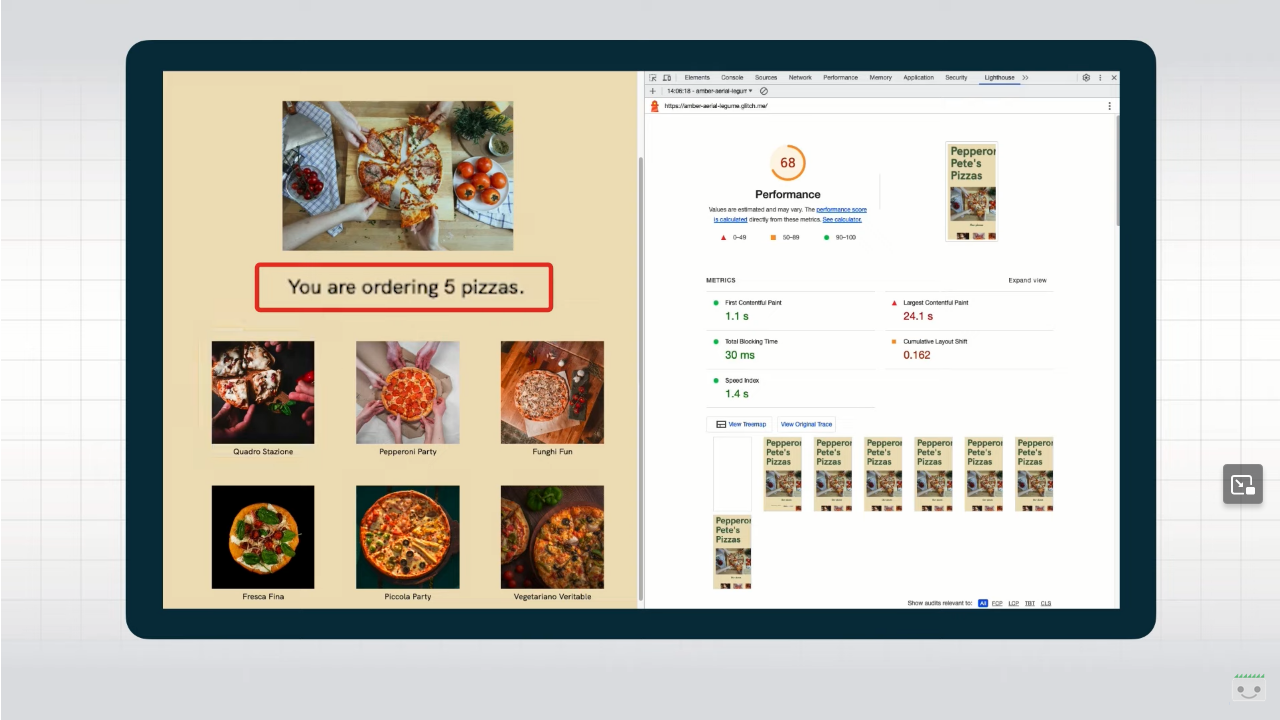
Picking up on the example shown in the video, the site chosen as a sample is doing very well in terms of performance, according to Lighthouse’s analysis: using it as a normal user, however, one only has to click on a button to find that suddenly the browser stops responding to clicks and subsequently adds an unwanted number of products to the shopping cart. This is undoubtedly a frustrating experience, but one that Lighthouse cannot report because it focuses on the initial loading of the page-which, admittedly, is fast.
The tool simply cannot catch these problems, which stem from layout changes or poor responsiveness, so we must evaluate the other alternatives present.
The other tools for debugging Core Web Vitals
“It’s time to bring out the bigger tools,” says Splitt, who introduces us to the DevTools Performance panel, which shows a range of information when we load a page and start the management control recording.
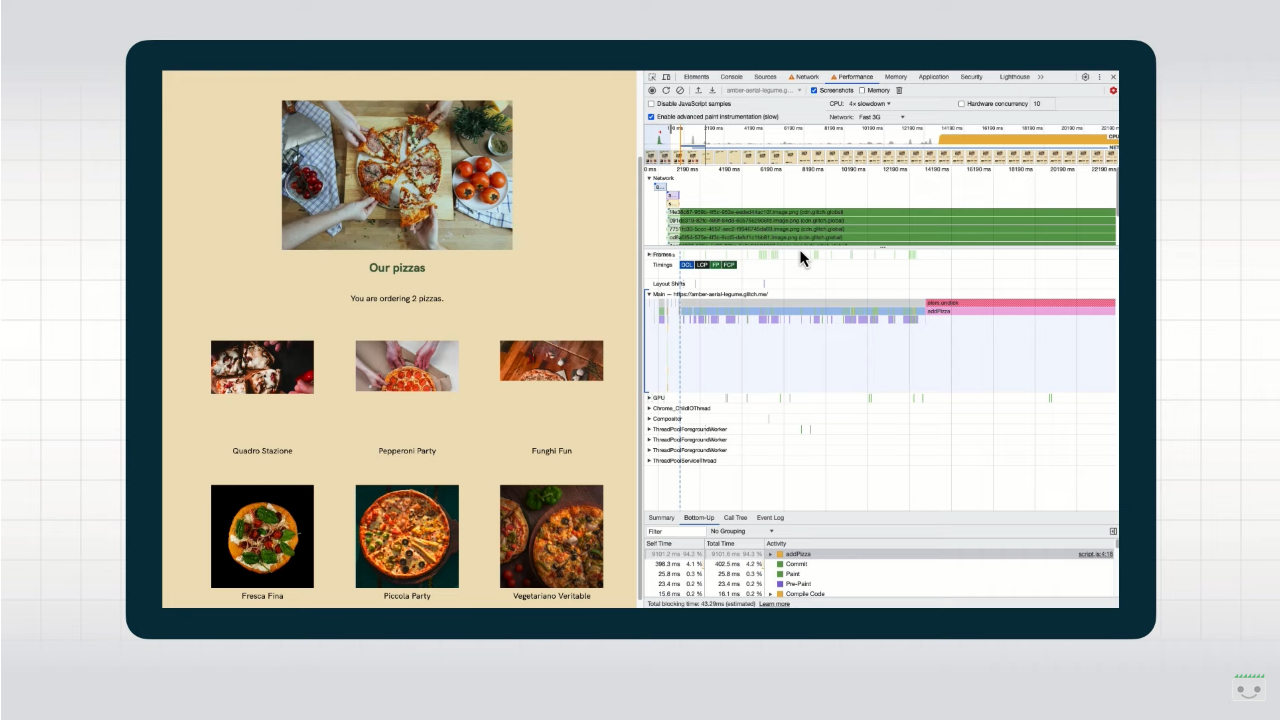
It might seem a little scary at first, the Googler admits, but it only takes a little practice to gain useful insights.
Looking at the screenshot, at the top we have an overview of all the activity in the browser tab, including some screenshots, a waterfall of all network requests and indication of when they happened, the Web Vitals timeline, if we enable it, and more detailed information about what’s going on behind the scenes.
With this panel we can delve into how network requests, JavaScript code execution, and Core Web Vitals work together.
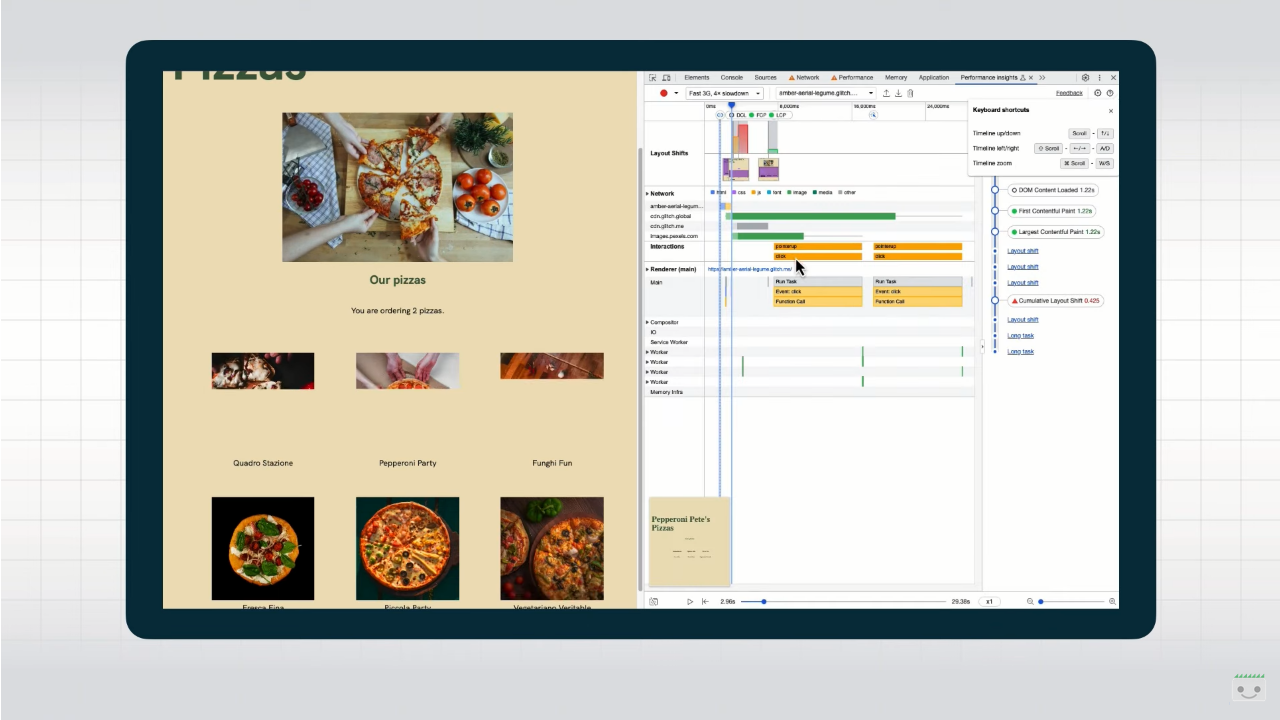
Additional Performance Insights are also available, presenting this same information on a perhaps more digestible timeline.
The big difference from Lighthouse is that here we can record performance during interactions with the page and, therefore, more easily discover responsiveness issues or layout changes.
Why use Chrome Devtools: the benefits
In his video, Martin Splitt quickly showed us how DevTools can help us debug problems with Core Web Vitals.
In his conclusions, the expert again dwells on the importance of field data, which is crucial for measuring the real user experience on our sites, but he also urges us not to underestimate the lab data provided by various tools, with which we can easily identify problems.
The big advantage here is debugging directly during development and as an ongoing process to identify problems as they arise, rather than intervening ex post on something that is broken and looking for a fix.