Local Search and Google My Business, main trends of 2020
The Coronavirus pandemic caused a rollercoaster effect on local search behaviors in 2020, because public health recommendations, Compulsions to stay at home and increases in virus infection rates have collectively influenced consumer behaviour. On a general level, the total searches and the overall visualizations in all the fields have reflected the progression and the impact of the global pandemic, as we already noticed last year, but an American study focused on Google My Business’ insight trends to analyze what happened.
The study of trends in local search
The research was carried out by Rio SEO, a local marketing platform (from which we obtained all the graphs on the page), which monitored US consumer trends in over 200 thousand locations in a range of verticals, noting the “dramatic effects” of the pandemic on local research and offering insights on how companies can become more effective in monitoring local search habits and exploit such changes to improve their economic performance – information and indications that can also be useful to the European market, where the scenarios were similar.
The starting point is, inevitably, the enormous consequences of COVID-19, which “shook the global economy and local search metrics reflect this impact down to the level of the individual store.”: the study manages to show how for affected brands have changed the clicks to the site, the clicks for call and the clicks for directions within the GMB tab, examining aggregated performance metrics to understand consumer behaviour and conversion trends in local search “that shaped the local business environment during the pandemic and early 2021”.
Covid-19 and business, what happened in 2020
On a general level, the pandemic “had a huge impact on the local search landscape in 2020″: in over 200 thousand locations in all the vertical tracks traced by Rio SEO local searches were volatile, with initial drops, recovery, increased volatility and a gradual return to pre-Eandean levels.
For this work, the team has “categorized locations and their data into six primary verticals: financial services, business services, restaurants, retail, healthcare and hospitality”. None of the sectors examined remained intact and unaltered, but those that were able to adapt to respond to the uncertain economic climate “have resisted better the pandemic storm”.
In more detail, the study looked at total searches, views, clicks and conversion actions of local search (click to call, click on website and click for directions), which “shed light on how and when consumer anxieties, lockdown measures, social distancing and workloads have impacted brands locally throughout the year”.
General trends emerged from the analysis
All verticals experienced “a substantial drop in total views from February to April 2020″, greater than the reflected impact in all metrics. May and June 2020 “led to a rapid recovery in most sectors due to the loosening of the initial lockdown and, in the fourth quarter of 2020, the percentage of growth/decline in many verticals became more connected, appearing to move together in all metrics”.
Total visualizations and searches shared a percentage change pattern, while click metrics were more volatile, especially in terms of directions to reach activities; In particular, total visualizations can be the best metric of “recovery” in all verticals, “since most seem to be returning to the pre-pandemic numbers of January/February 2020 over time”.
Among the major global trends, it highlights how the metrics of local hospitality marketing “have not recovered at all the pre-dawn figures, however we continue to see them slowly increase with time”.
Virtual health visits increased in 2020, as did the need for healthcare brands “to show new security attributes in their local listings: there was a 154% increase in telemedical visits during the last week of March 2020, compared to the same period in 2019, a trend that became very popular in the health sector in 2020, as patients opted for virtual visits rather than in person”.
Many users looked for “more information on where they could run a COVID-19 test and if an appointment was needed; more recently, many are curious about where they can get the COVID-19 vaccine, if eligible”.
How the pandemic impacted local search in the USA
The study focuses on local search trends in relation to increased (and renewed) consumer concerns and needs.
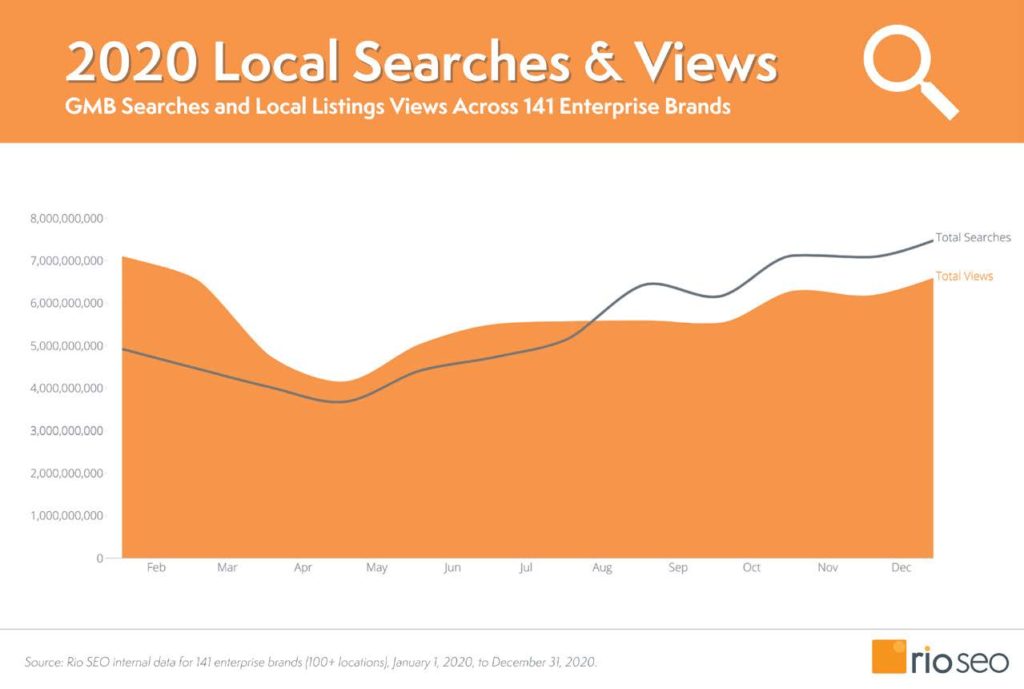
Beginning in March and April 2020, a “dramatic decline in total searches began, as many jobs were closed and Americans were advised, or ordered, to stay home”. Local search began to bounce sharply in May, when restrictions were removed in some areas, a trend that remained strong until June. Throughout the rest of the year, search volume and total search views increased and decreased “as regions of the United States experimented with waves of COVID-19 cases and responded in turn”.
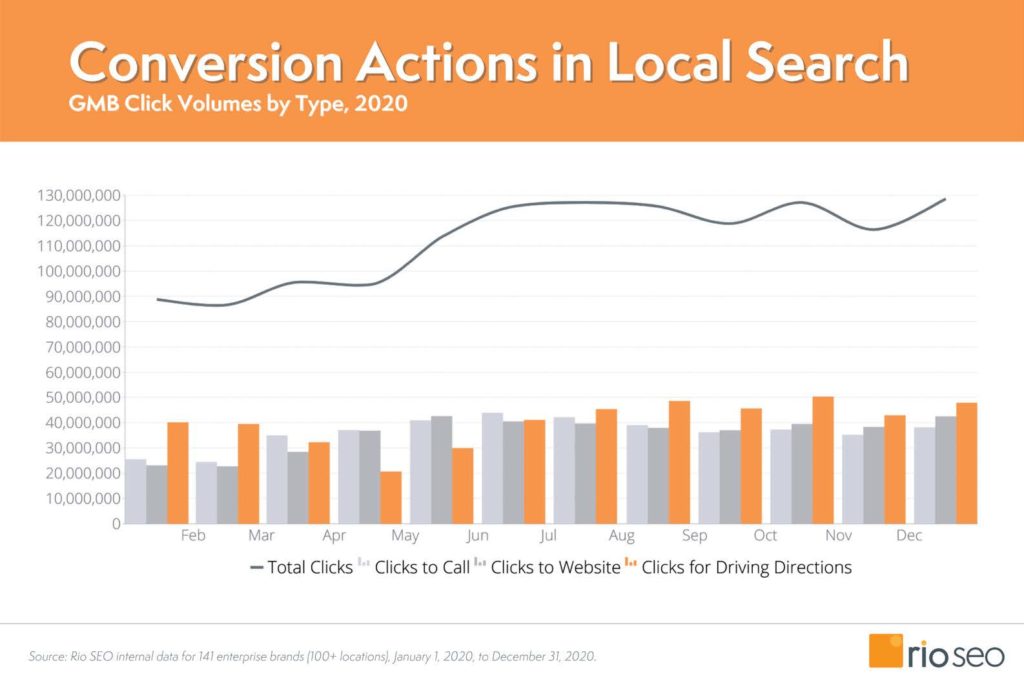
The initial months of the pandemic have also led to a drop in total clicks, but to an extremely small extent compared to the collapse of other metrics; “as the pandemic progressed, when even routine walks became filled with questions about shop closures and security measures, consumer information needs grew,” and this was seen in the increase in total clicks from May onwards.
The effects of Google My Business conversion metrics
Also interesting is the analysis of the main conversion metrics of GMB tabs, which highlights some relevant trends.
- Clicks to call
The clicks to call “skyrocketed in March for most verticals”, with financial services peaking in April and services instead in May, and great general volatility until August.
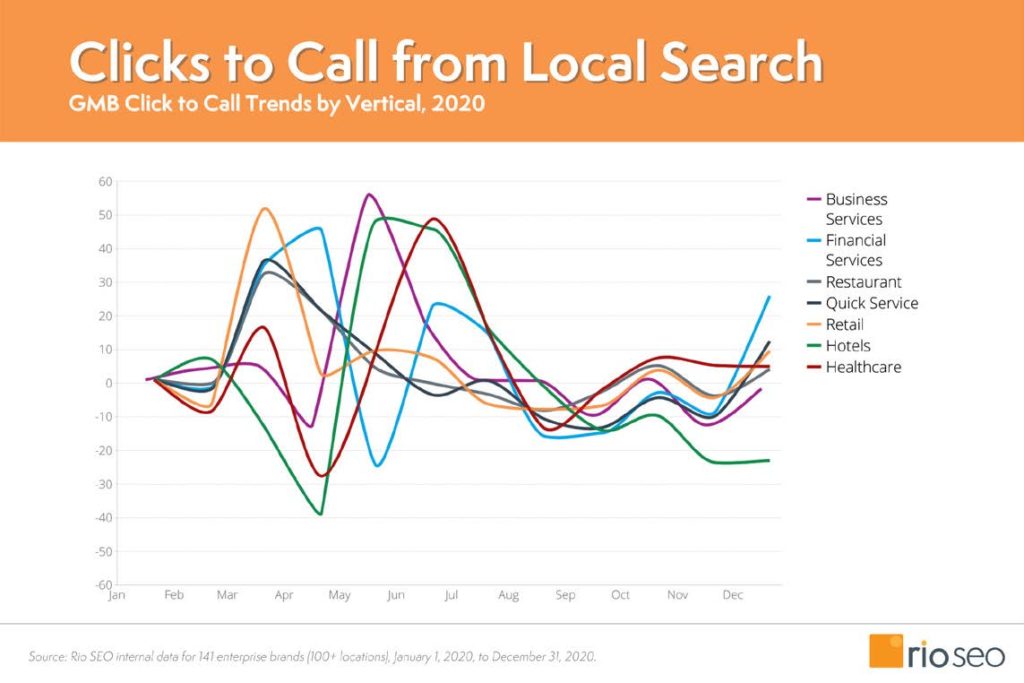
This situation may be related to uncertainty about what constitutes an “essential business“, which may have prompted people to check if an activity was open during the first months of the pandemic, and then return to “normality” in the following months.
- Clicks to Website
As the pandemic led to the closure of the economy, clicks to the website went up in March and April.
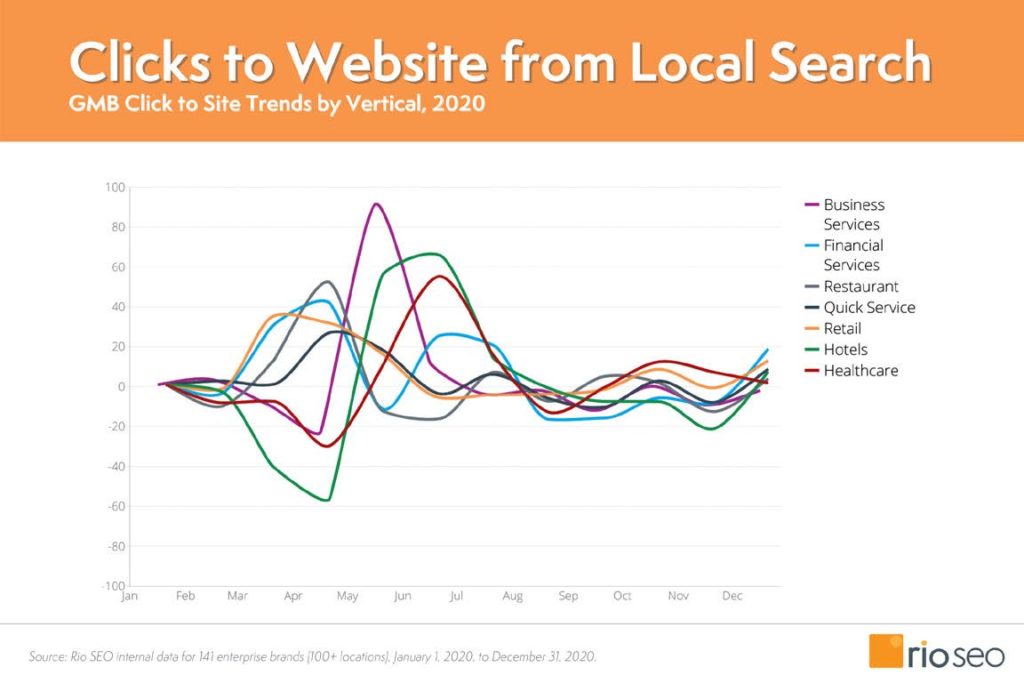
Growth moderated in May, remained relatively stable during the summer, and then declined in September and remained constant in October; there was another decline in November and a final rebound in December, coinciding with the several waves following the first.
- Clicks for Directions
The clicks for Directions – clicks on the GMB tab to get directions to achieve physical activity – collapsed in May and June, when home delivery became for many the favorite channel to shop.
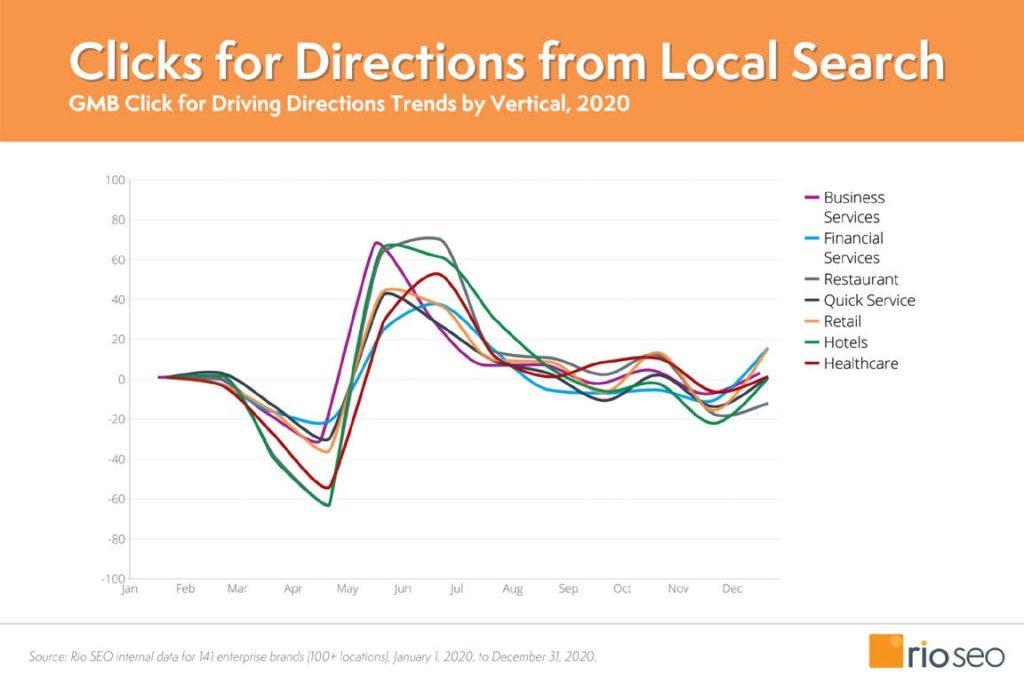
When local businesses launched online shopping and pickup options on the sidewalk or reopened (though often on a restricted basis or with capacity limitations), requests for directions from local search increased again.
Pandemic and sectors, the consequences according to the study
The next chapters of the work focus on the detailed analysis of the behaviour of the sectors in 2020 and, therefore, the impact that the pandemic has had on these vertical industries.
- Financial services
The financial services recorded a significant drop in views from March to May, when they resumed to rise even without going back to the pre-pandemic levels again.
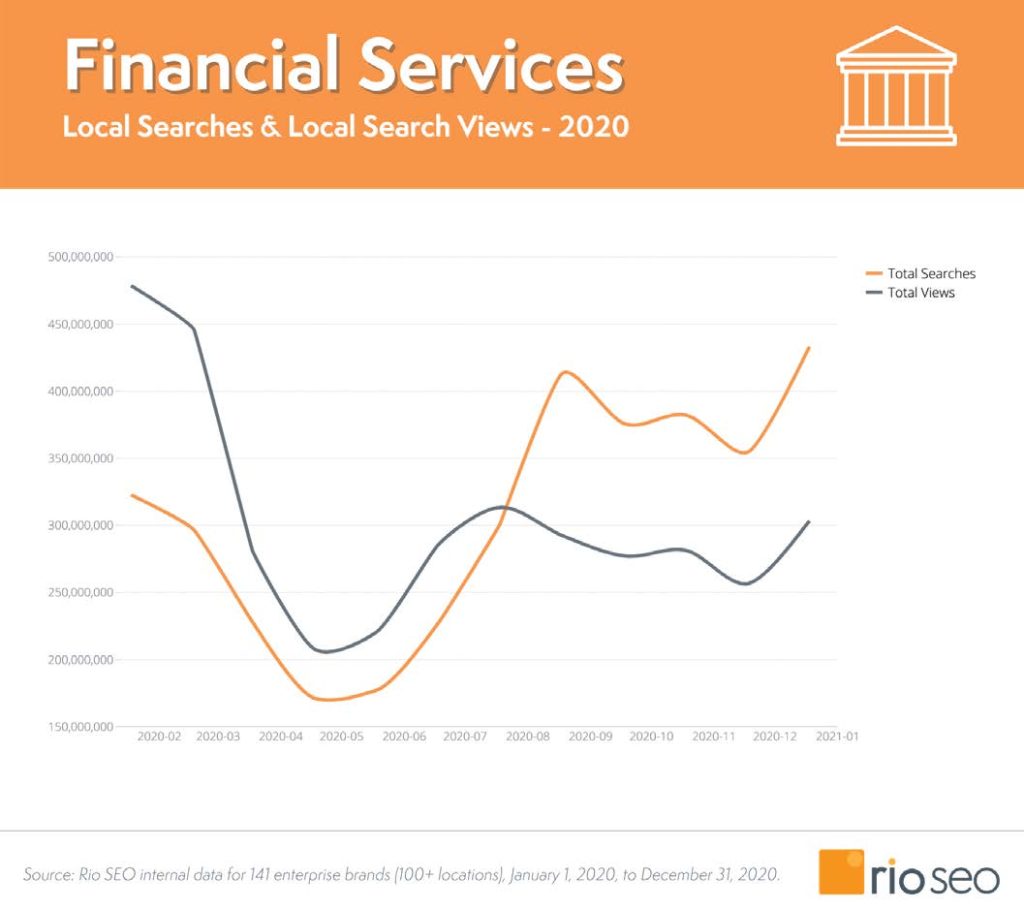
However, the total searches and clicks went better, closing the year at a higher level than the pre-pandemic January 2020.
- Business Services
Business services suffered during the pandemic, no doubt due to the phenomenon of work from home. What began as “a strong year in terms of visualizations dropped in March, starting to regain strength only in June”.
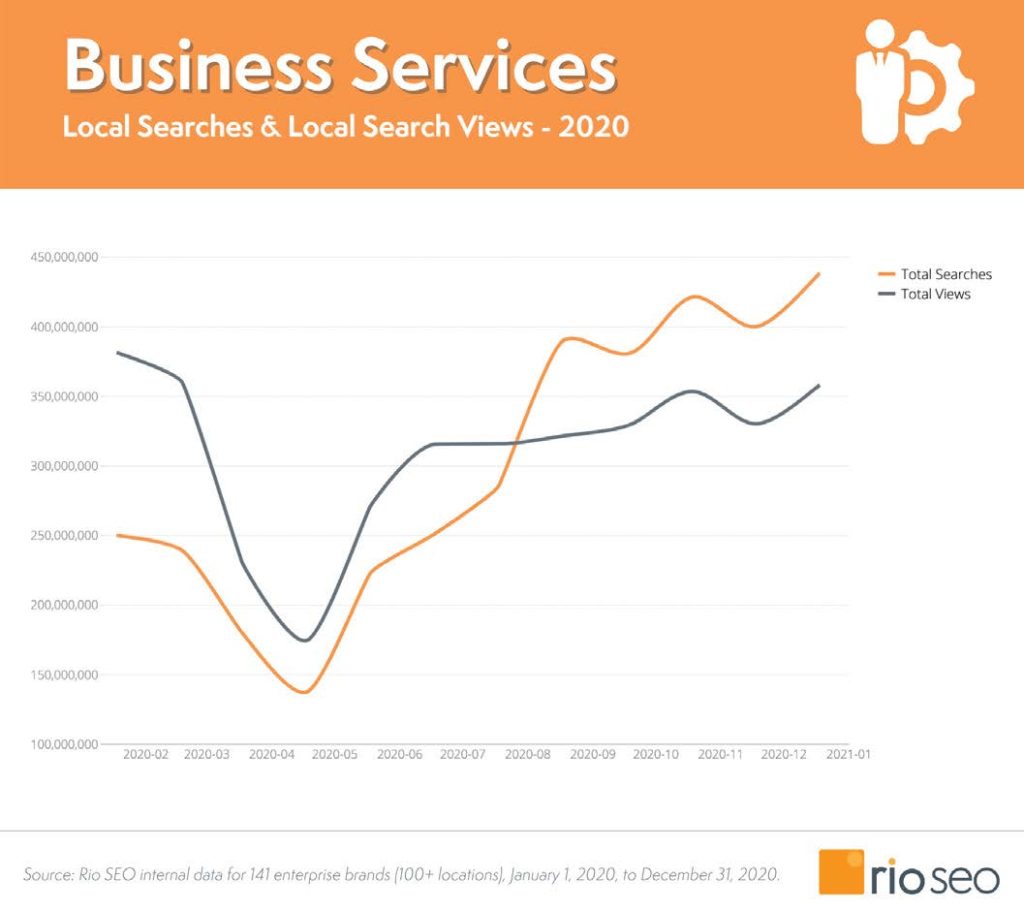
Local search and visualization had a huge success in March and April 2020: the vertical of corporate services recorded the highest percentage changes for all metrics, increasing dramatically in most indicators in May 2020.
- Restaurants
The catering industry has been among the hardest hit by the pandemic: in many American states (but not only, as we know) “Public health regulations have forced restaurants to move only towards delivery and take-away, which explains the decrease in user search behavior”.
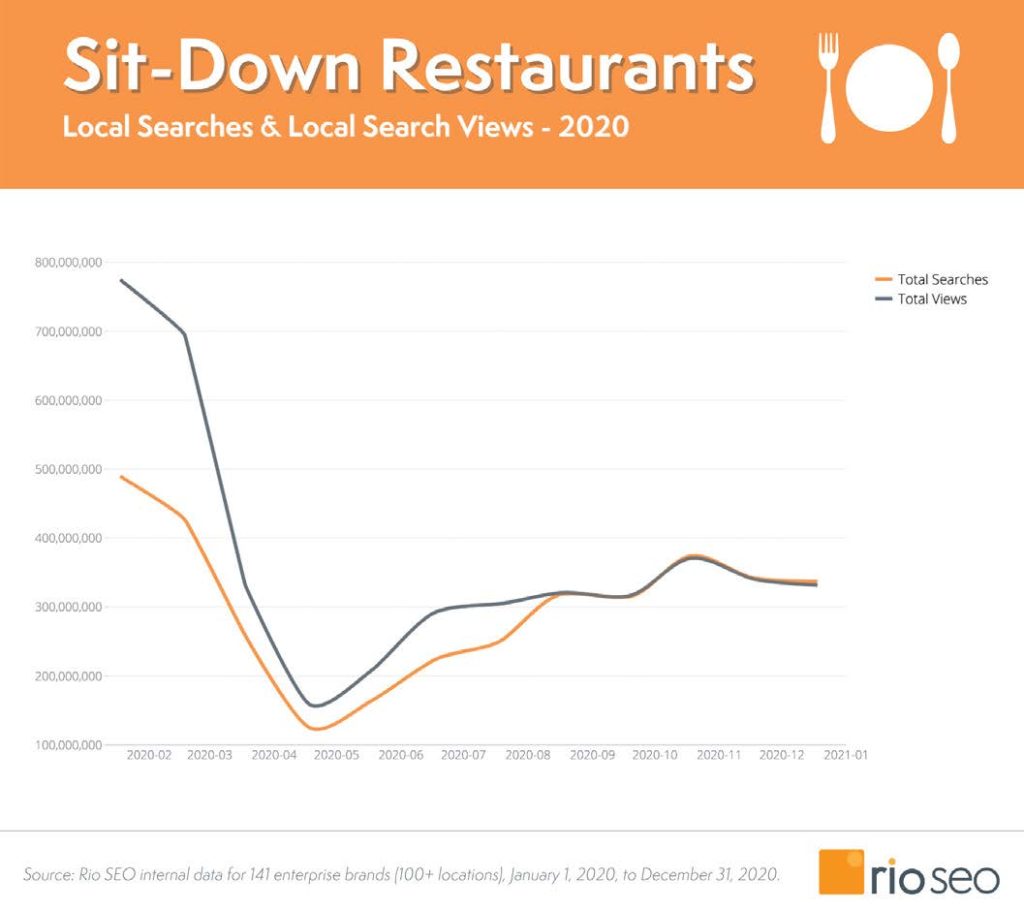
The consequence is a progressive decrease in visualizations and clicks have decreased throughout 2020, while the clicks for phone calls and clicks on the website have exceeded pre-metricsCOVID – probably because people were interested in whether the restaurant was open or had a home delivery service.
- Retail
Retail has been an area of local business that has been able to continue to function during the pandemic, suffering less turbulence than the other vertical interested. Initially, however, retailers were also initially hit hard by the effects of the COVID-19, but overall showed the most consistent performance in 2020, with declines and gains in many metrics.
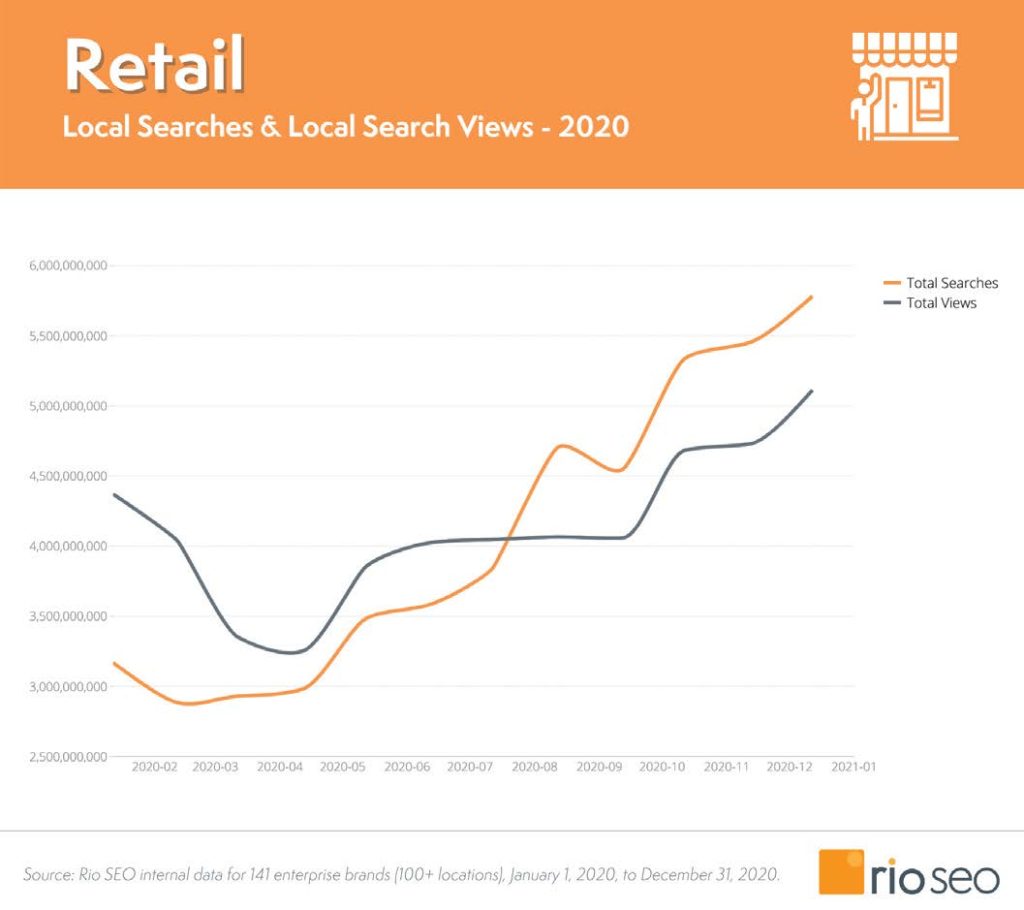
The retail clicks were the ones that showed the lower drop across all vertical sectors, while website clicks and street directions recorded only slight decreases during the year, but from December 2020 were increasing.
In particular, from October to December 2020 total views had already exceeded pre-summer levels, and even total searches showed an upward trend, reaching their peak in December 2020 (largely due to Christmas shopping).
- Healthcare
Healthcare started the pandemic with a decline, just like other niches.
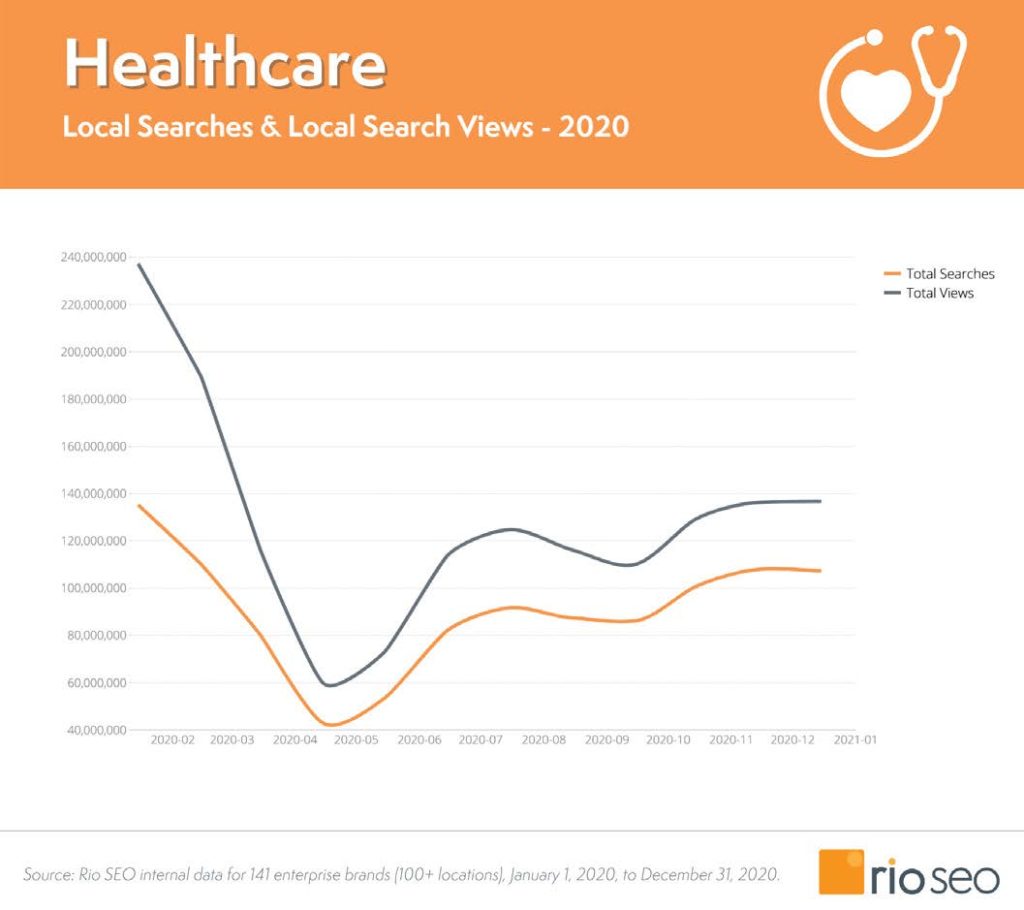
However, the industry as a whole has continued to regain views and searches since June 2020, and in the end the clicks for phone calls and on the website have gone exceptionally well and have almost reached pre-pandemic levels.
- Hospitality
The hospitality industry was crushed at the beginning of the pandemic due to warnings against travels and tourism, but managed to stage “a modest rebound since June, with research and visualizations that have begun to slowly going back to the limelight and have remained stable since then”.
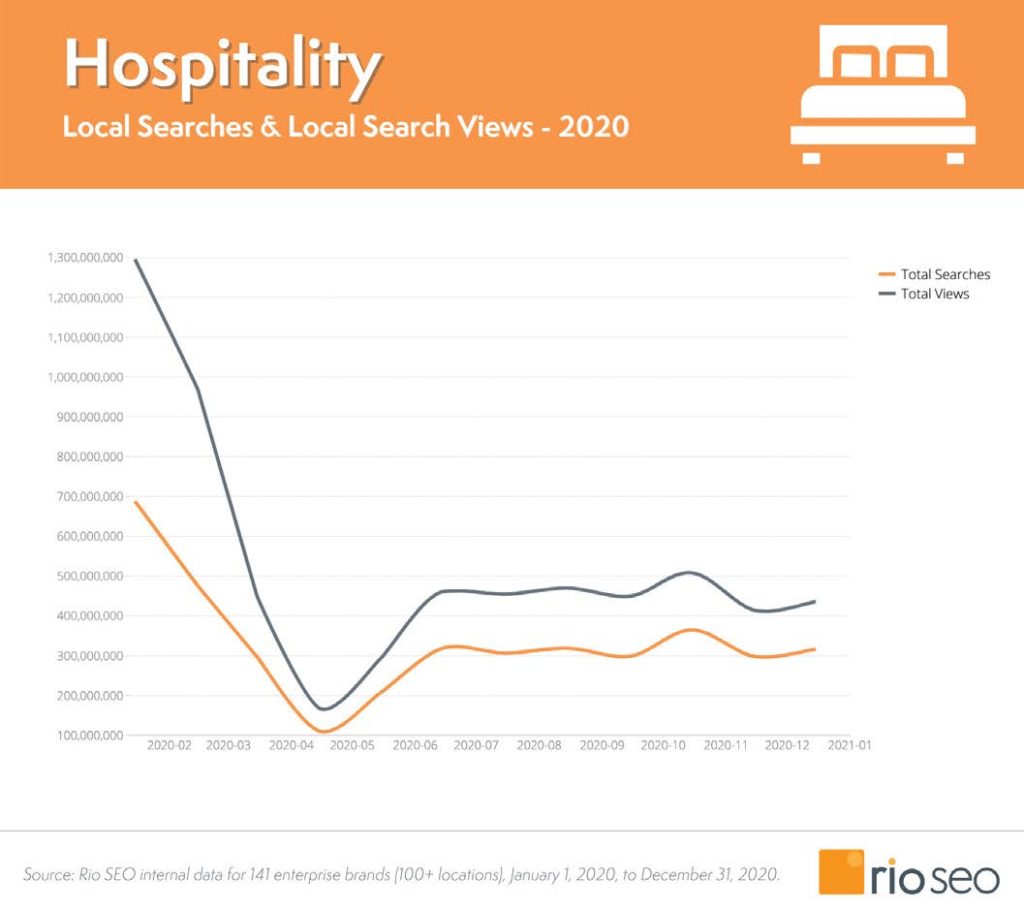
The trends however show an inevitable decline in the number of consumers who have searched and viewed hotel cards.
Conclusions on user behaviour in 2020
It is clear that the pandemic has caused lasting changes in user behavior, and this study helps us understand how and how different are the ways in which people have interacted with Google My Business, and in particular with maps and lists of business activities to contact and do business with local businesses.
The takeaway we can take is – once again – the importance of data and monitoring user behavior in order to better respond to rapidly changing trends of local search consumers.