Verifying pages with the Search Console URL inspection tool
Google Search Console is a powerful tool with so many features and reports available to those who manage a site’s digital strategies. Today’s guides to using the webmaster tools contained in the GSC take us deeper into how the URL Inspection Tool works, which allows you to find out a page’s status in the Google Index, do live tests, ask the search engine to scan a specific page, and much more. Although at first glance it seems quite simple if not “limited,” in fact, the tool offers some really useful insights to those who pay the proper attention and allows us to explore the “behind the scenes” of our site’s URLs to find very beneficial additional insights.
Guide to the use of the Url Inspection Tool
Our companion and guide in the discovery of this tool is, as always, Daniel Waisberg with the series Google Search Console Training on YouTube, now at its fifth episode: right after the coverage of general topics such as the verification of site ownership and others more technical like the Performance Report, the Search Advocate now offers us some practical advice on the URL Inspection tool that, as previously mentioned, is very useful to acquire info on the version of a specific page indexed by Google and, in particular, on AMP errors or structured data and indexing issues.
Understanding why the page does not appear in Search
According to the Googler, this is one of the “most important debugging tools to help you understand why your page might not be appearing the way you expect in search results”. In order to read the detailed info of the Google Index correlated to a URL within our property all it takes is to launch the tool through one of the methods available – the top bar in the navigational menu, the side navigational box or the magnifying glass next to each Url in the other Search Console sections – and immediately find out the current indexing status of the monitored resource.
To get results, we need to enter the complete Url of the page and to always keep in mind that:
- The tool only works with Web pages and only show results for Web research.
- The URL must be inside the current property for it to be tested.
- It is possible to check both the AMP URLs and the non-AMP version of the page.
- If the page owns any alternative or duplicated version, the report also provides info on the canonical Url, if included within one of your properties.
Deepening info relative to the pagina
Three sections will open up at this point, presenting information relative to the last Google scan or to the last registered crawling attempt – it is not a real-time test, then, but it rather describe the most recent indexed version of a page, not the one published on the Web.
Checking presence on Google
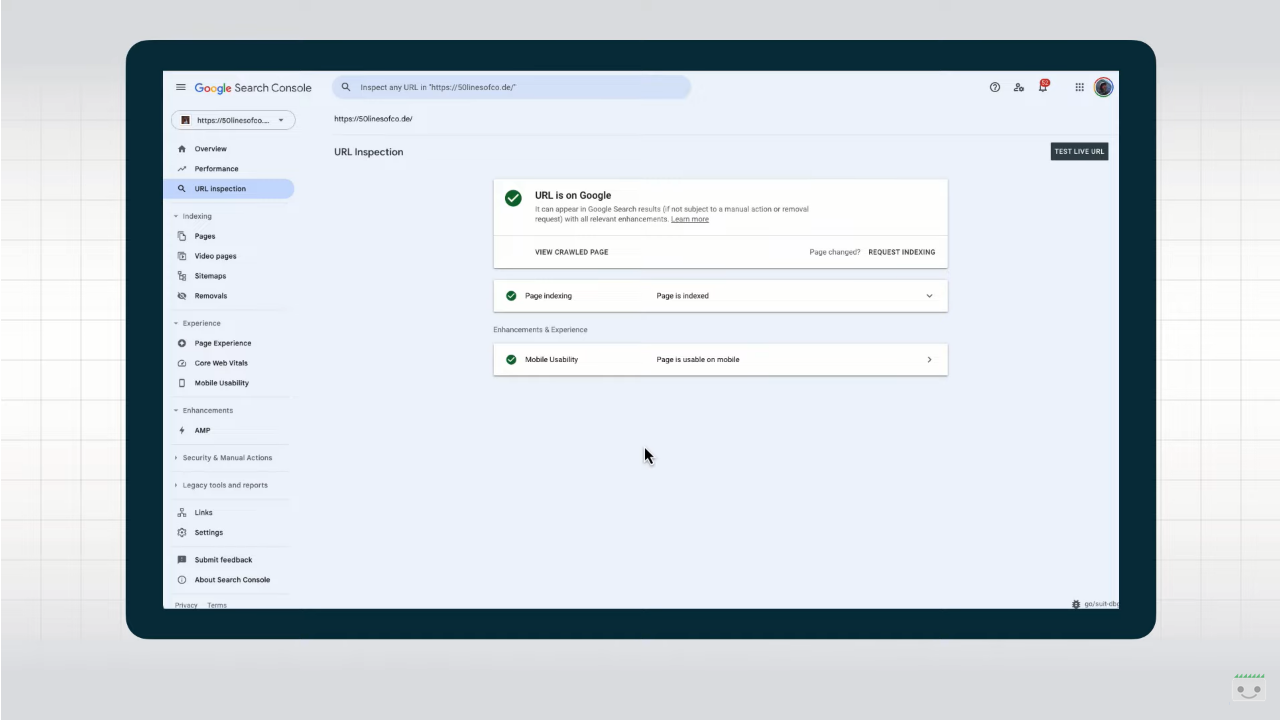
In the Presence area on Google we discover if the URL appears or not among Google Research results through five possible values:
- The URL is on Google, and then there are no issues at all.
- The URL is on Google, but has some problems. The page is indexed and appears among search results, but there might be some critical issues with structured data or other elements like AMP.
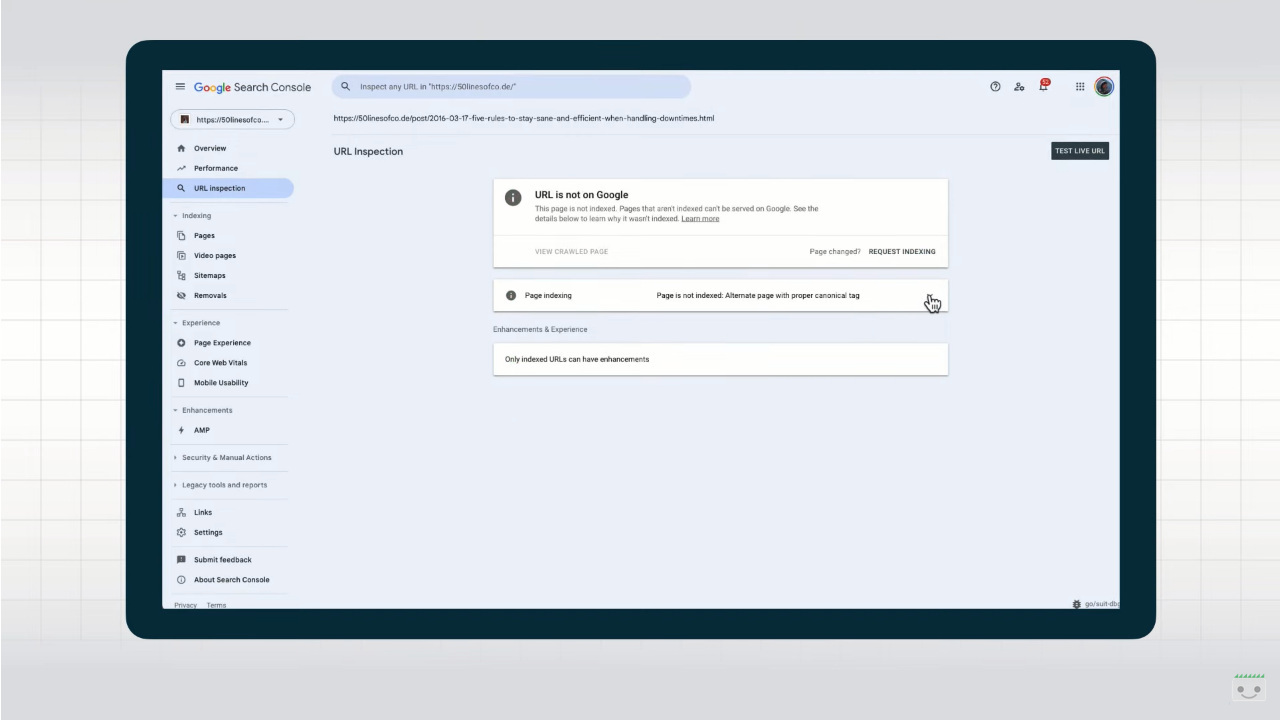
- The URL is not on Google: indexing errors. On the page there is at least one critical error that blocked the indexing.
- L’URL is not on Google. The page does not appear, generally as deliberately blocked with a password, a noindex instruction or alternative version of a canonical page.
- The URL is unknown to Google. Google did not index the page because it never detected it in the past or it appears to be an alternative page correctly marked, but that it was not possible to actually scan.
Verify Index coverage
In the coverage section we can verify the Url’s indexing status and some further details about the indexing procedure. For instance, the known sitemaps leading back to the Urls or referral pages that linked it, but also the time of the last scan performed by Google and from which user agent, the general status code and canonicalization status.
Finding out possible enhancements
Lastly, the Enhancements area reports possible optimization interventions identified by Google regarding the URL during last indexing. Here there are indications on the usability from mobile devices, on the connected AMP versions and on the structured data used, along with the marking of possible errors with each of those elements.
Furter optimization interventions and live test
once obtained these info on page status, we have three specific actions to put into practice: firs of all, we can check a URL published with a real-time test so to see if the page can be indexed and if the edits worked on it solved the problems or not, in order to confirm if Googlebot is allowed (or not) to access the page for indexing.
It is also possible to request a new indexing, if we did any change (sometimes also waiting several weeks for the operation to be completed) and, in the end, we can display the rendered page to gain more info, to find out how Googlebot actually sees it and gain info on HTTP status and on loaded resources.
Getting the most out of the URL Inspection Tool
More recently, in August 2023, however, it was Martin Splitt who turned the spotlight back on this tool, with a video in Search Central’s Lightning Talks series in which he begins by calling the URL Control Tool “one of the best parts” of Search Console.
As we know, the tool is activated either by manually clicking on the name in the dashboard or by entering a URL in the search bar within the property we are operating on. At first glance, it seems pretty straightforward and informs us whether the URL is indexed, whether there are possible improvements, whether it is optimized for mobile devices, but it allows us to “dig a little deeper than that,” Splitt anticipates.
Specifically, from a simple screen that has some green checkmarks we can actually launch to delve into details such as the raw HTTP response, including all response headers, JavaScript console logs, and information about the canonical URL selected by Google.
Extending visualization and information
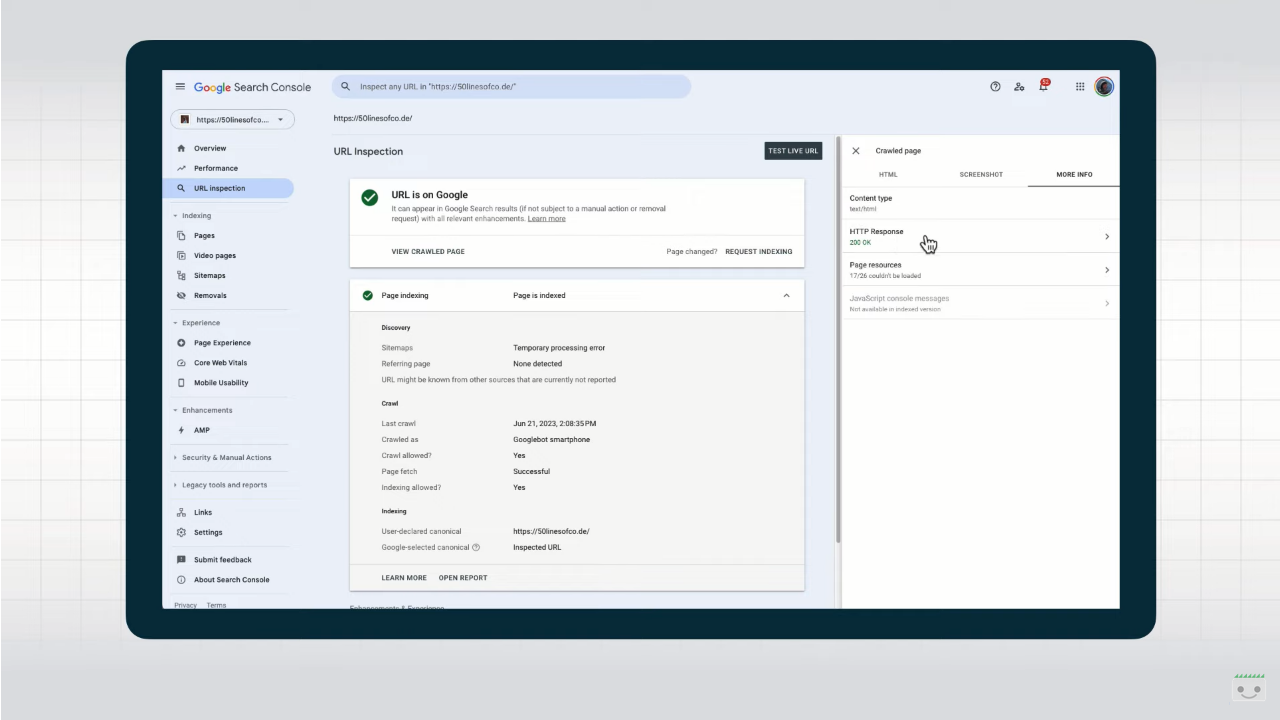
The first suggestion that comes from the expert team member for Google Search reports is to expand the information presented on the screen, as shown in the video: in this way, we get details about the discovery of this page-for example, whether it was found via sitemap or a referring page, also indicating which page it was. We also read what is the canonical URL provided on the page with the rel=”canonical” link tag and the canonical URL that Google ended up choosing, and then again the date of the last crawl, whether the crawl was allowed, which Googlebot performed the crawl, whether indexing is allowed, and if not, what it is blocked by. Finally, the “improvements and experience” section leads to the relevant reports.
By clicking on “View Crawled Page” we get some additional super useful information, which appears in the side box. We start with rendered HTML, what Google Search uses for indexing and representing what Google Search “saw” on the page when it crawled and rendered it. We can use this text in conjunction with a search function to check whether the content is available to Google or not, Splitt suggests.
Even more valuable is the “More Information” tab, which reveals to us the HTTP status code of the examined page and, by clicking on it, all the HTTP response headers returning from the server. We need this to check for X-robots directives or other problems with the server configuration.
How to debug problems
Going back to the page resources, we discover other information that we can use to debug problems with a page, and in particular we see what requests were made during crawling and rendering, with an indication of possible reasons for failure.
In the example shown, some resources loaded via JavaScript were not crawled because they were blocked by robots.txt: if these contain important content on the page, this means that Google Search could not access that content, which therefore will not have visibility.

This other error that Splitt dwells on is “complicated”: it usually means that something has blocked Google from retrieving that resource, either because it didn’t really need it for rendering and indexing (like fonts, for example) or because it took too long to get there.
Usually, however, this is a transient thing on Google’s site and not much to worry about, the expert reassures us.
Returning to the summary page, the tool also shows us any “JavaScript console messages” that might give us hints about what is happening when the page is rendered. The information present is “understandable” to those with specific skills, Splitt anticipates, and a developer “might be able to make sense of the messages for your specific application.”
The live test on URLs
All this information is not only available for the version of the page that Google has recently scanned, but we can also skip any cache and do a live test on this URL.
The live test might give slightly different results if we run it several times, precisely because it does not use caches but also because it processes the information very quickly, and sometimes some resources might not finish scanning in time and so the output might differ between runs.
Returning again to the main summary screen, we can now also analyze the screenshot of the checked page, which is useful for getting a “first look” at the resource, although in most cases it is more fruitful to focus on the HTML, the page resources, and the HTTP response, however.