Google Search Console Insights,how the new Google platform works
Three months have already passed since the official debut of Google Search Console Insights, the suite that combines both the data of Google Search Console (GSC) and Google Analytics (GA) and makes them available in customized form for content authors and website owners. Let’s try to take a look at the functioning of the platform that gives us a more holistic view of what is happening on our site and to solve some of the doubts raised so far by users.
How Search Console Insights Works
The main and most interesting feature of Search Console Insights is the ability to find for the first time data gathered from two crucial tools for SEO such as GSC and Analytics: in the intentions of Google, this will help authors and site owners “make informed decisions and improve their content”.
Thanks to the insights provided by the suite, in fact, you can discover trends, performance and activities of users in relation to the pages of their site, with relevant and targeted information that can be used to guide and optimize the SEO strategy, possibly taking action to correct pages that are not leading to real results despite efforts.
How to access Search Console Insights
Access to Google Search Console Insights is really easy and there are three different ways to get into your panel:
- Click on the direct link to this page.
- Select Search Console Insights at the top of the Search Console overview screen.
- In the Google app for iOS, select Search Console Insights in the account menu.
To get the full experience of Google Search Console Insights it is important to associate the two GA and GSC accounts; if you do not use Google Analytics (or you use the version Google Analytics 4, which for now is not supported) there is still access to Insights, but the data flow will be limited.
What is Google Search Console Insights for
The platform focuses on content, which is crucial for attracting and engaging the public and, as a result, achieving the goal of increasing website traffic and achieving more conversions.
For these reasons, the analytical tool launched by Mountain View shows the creators which content is helping them achieve their goals and which do not work as expected, and also helps them understand how their target market discovers the contents of their site, so as to draw useful guidance to influence the behavior of users.
In particular, Google Search Console Insights provides data on:
- Page views.
- Average length of page view.
- Site content/articles that received their first views in the last 28 days.
- Most popular content.
- Main traffic channels, to discover the main source of visits. It is divided into Direct (visitors who have arrived at the content without clicking on a link from another website, search engine or social media platform), Organic Search (users who have clicked on search engine results) and Referral (visitors who had access to the content via links from other web pages).
- Data on how users find content on Google Search – which social media platforms, reference links and Google search terms bring users to content.
- Referring links, to find out which web pages link to our content and how many views this channel has provided in the last 28 days.
- Main social media channels: the tool describes in detail how many page views have been received via social media in the last 28 days, where the traffic comes from and how long the content has been viewed.
Information appearing in the tool
Google Search Console Insights, then, not only shows which of the content published by the site have the best performance and/or which ones are trending, but also describes how people discover such content, what users look for on Google before landing on those pages and what articles eventually lead users to the site thanks to links.
In addition, the tool also provides little tips on how to improve content performance.
On the practical front, in addition to the most obvious ideas, these data can also help us to understand how the contents are viewed daily, and then guess which days in the week are the more “busy” ones and give the greatest involvement, so as to set up an efficient strategy to share items at the most optimal time. Or, they support us in understanding the possible causes of significant drops or peaks in page views, possibly linked to the sharing of a content that is poorly appreciated or not well cared for.
Main doubts about Search Console Insights
At the end of these first test months – and an even longer beta phase, since this tool had already been anticipated in 2020 – the Google team decided to share some of the most common questions and doubts about the functioning of the platform, and in particular Maya Mamo and Daniel Waisberg sign the article that clarifies some aspects that have appeared difficult so far.
Problems with data display
One of the most critical elements is, inevitably, the access to the suite and data: many have complained about the impossibility of seeing Google Analytics data in Search Console Insights, and there are some causes behind this problem, obviously linked to the association between the properties of GA and GSC.
In particular, the Googlers reveal that there are 3 errors that can lead to the failure to display Analytics data in the new platform:
- No association between GSC and GA properties. Specifically, the article suggests, if we have separate properties for HTTP and HTTPS traffic on GSC we must verify “to associate the property that receives the most traffic or evaluate the possibility of verifying a Domain property to include all traffic in one place”.
- Absence of sufficient permissions on GA. If the GSC property is associated with a GA property, but it is not yet possible to view this data, check if we have the Read and Analyze permissions for the associated GA property.
- Error in GA view selection in GSC. GSC Insights provides GA data for a specific GA view in the associated property: if there are no views within the property, Google cannot complete the data. To solve this problem, simply view or edit the selected display on the Search Console Associations page.
Differences among displayed data
Another aspect that causes some doubt is the difference between the data shown in GA and those present in Search Console Insights: actually, as explained by the two members of the Google team, the data of GA and GSC are different by definition, as “one represents the activity carried out in Google Search, while the other represents the behavior of users on your site”.
Moreover, there are at least 3 aspects that vary specifically and therefore generate the discrepancy:
- Page title and URL. Although some reports in GSC are based on Urls, GSC Insights uses the GA page title size: for each page title, there may be several Urls and GSC Insights extracts the most prominent canonical URL to retrieve search data.
- Intervals of dates. GSC Insights shows GA data for the last 28 days (the last day may use partial data), sometimes compared to the previous 28 days. The default time intervals of GA and GSC are different, so the discrepancy may depend on comparison over different time periods. Also, even if we set the time zone to GA, GSC Insights always uses Pacific Daylight Savings Time (PDT), so even specific days may be different if compared.
- Metrics. GSC Insights combines GA metrics (page views, average page time) with Search metrics (click, average location), which metrics represent different aspects of the site and are calculated differently.
Analysis of new content
Even the definition of “new content” of the platform can open to some small problem, especially in the initial understanding.
It is therefore important to understand that the new content tab shows the pages of our site that received the first page views in the previous 28 days. For each title, Google may also indicate the main search queries for the main canonical URL.
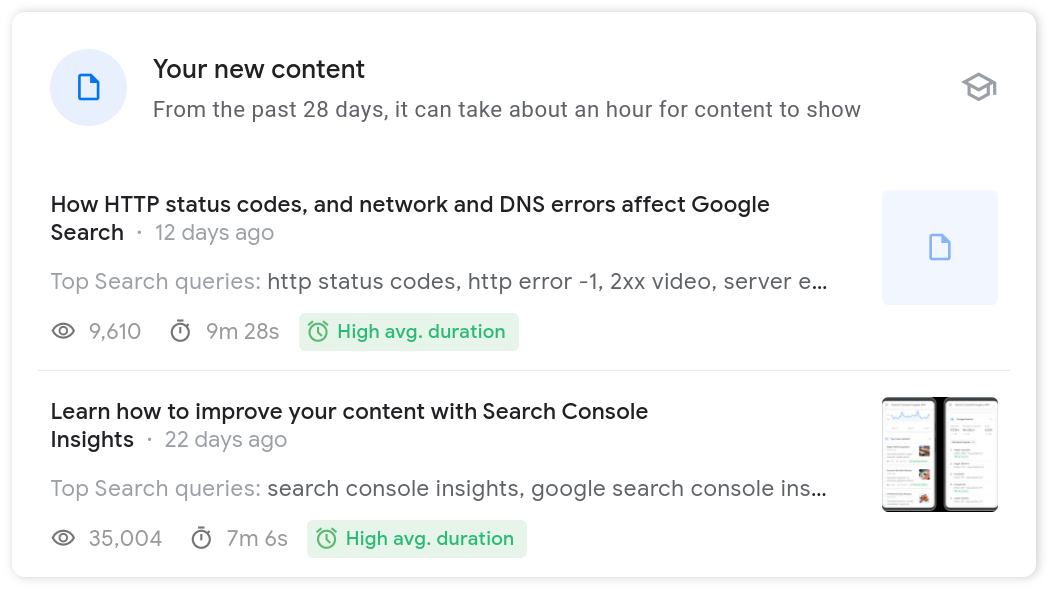
Contents are sorted according to the most recent and, in order to be shown, they must have received some views. There are three main pieces of information used to fill out this form:
- Checking page titles that have received traffic in the last 28 days, but that had not received any traffic in the previous year.
- Filtering (with various rules for clearing data) pages with fewer chances of being new content – for instance, says the article, “title changes, comment pages, internal search results pages and more”.
- Exclusion of translations of the same content to maintain the title with the best performance. The metrics of translated pages are not aggregated to avoid confusion with the metrics in the GA interface.
As a further warning, Mamo and Waisberg write that if the platform does not report our new content “it does not mean that they do not have GA traffic or have not been indexed”: GSC Insights can show content not indexed during data extraction from GA, and also the definition of “new” does not depend on the first hour of scanning, so they do not need to be scanned or indexed to be shown on this card.
What are the most appreciated contents
Similar perplexities there may be on the definition of most appreciated (or “popular”) content: in this tab, Google shows the page titles with the best performance based on page views in the last 28 days. For each title, GSC Insights can also indicate the main search queries for the main canonical URL, and by clicking on the title we can expand the display of data and check the detailed overview of the page.

Caution: if the URL is not in the associated GSC property, the report will not be able to provide Search data.
GSC Insights and referral links
The first feedback from users of this tool also focused on how Search Console Insights chooses referral links from other websites, and then shows how users discover the contents of our site through links to your content on the pages of other sites.
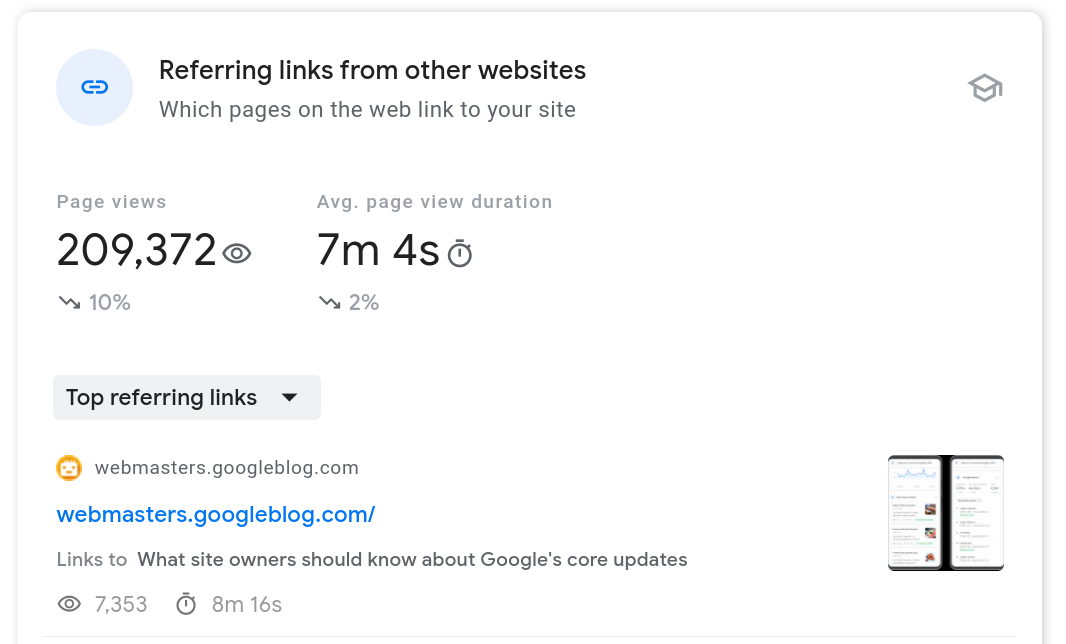
Google’s goal with this report is to show how many accesses to a site were generated by a specific referral page: in GA, the analysis of the traffic from a specific referral includes all page views in the current session; in GSC Insights, instead, only one page view is counted for each incoming session by a specific referral. Ultimately, the traffic shown in the Insights tab “is just a subset of the traffic from referrals you usually see in GA”.
Discrepancies between click data and page views
Sometimes, clicks are lower than page views, and this may depend on three reasons:
- Each click can activate more than one page view.
- A page views for Google/Organic Search include more platforms than web search results (such as Discover, Image Search and Video Search).
- GA and GSC do not necessarily generate reports on the same group of pages: for example, a GSC account can only include HTTP pages while the GA view shows reports on both HTTP and HTTPS.
Meaning of the different badges
The last “controversial” or at least unclear point at first glance is the meaning of the different badges present among GSC Insights tabs, that are needed to help “to focus attention on interesting patterns in the data”.
At the moment, there are 3 badges available:
- High average duration, along with content that have a high average duration compared to the others of our site. It then indicates potential themes and articles that the audience found interesting.
- Top 5 results, which signals that the average position in Google Search (organic search) of that content in the last 28 days for the specific query is 5 or less.
- x% trend, which is a comparison between the performance of the last 28 days and the previous one: this badge is displayed only when the trend is significantly higher than the general trend of the site.