Looker Studio: how to integrate Search Console data and SEOZoom
“If you can’t measure something, you can’t improve it, ” said Lord Kelvin; reversing the formula of this archaic aphorism, then, if we can measure a parameter we can improve it, or at least we have an opportunity to do so. And it is precisely this that explains the value and importance of learning to estimate certain key aspects related to our site’s performance – KPIs, but not only – in order to identify possible areas on which to intervene to increase returns and results. Support in this regard comes from one of the many tools provided by Google, namely Looker Studio, which is emerging as a powerful tool for visualizing and interpreting complex data sets, including analysis of website search traffic both through integration with data from Google Search Console and those provided by SEOZoom!
What Google Looker Studio is
Looker Studio is a powerful business intelligence tool that allows you to create custom reports and dashboards and present data in a visually appealing and easily understood format.
Integrated into the Google Marketing Platform package, Looker Studio specifically enables the creation of customized reports and dashboards with the purpose of making better, more informed decisions or simplifying reporting to customers and stakeholders. For this, it allows us to understand and use the data most relevant to our online business, giving us a way to visualize information more clearly and intuitively, to identify hidden trends and relationships.
For example, we can create a report that shows sales by product or a dashboard that tracks the performance of our website by connecting with various data sources, including Google Search Console and even our own SEOZoom!
In concrete terms, then, this business intelligence platform helps us turn data into a picture by synchronizing all the data sources we have into one unified reporting experience. In fact, Google Looker Studio currently supports over 800 different data sources and over 600 data connectors-a connector is essentially the tool that allows you to import data from a software within Looker Studio.
What Looker Studio is for: main features and benefits
In a nutshell, Google Looker Studio allows you to quickly and easily put together powerful data visualizations that can be used to tell a digital marketing story, i.e., supporting the creation of informative and visual charts, tables and dashboards that are easy to interpret, share and customize.
But there is a “plus”: Looker Studio helps go beyond data visualization because it aims to help marketers make more data-driven decisions for their clients and brands, making the reporting process more efficient and productive.
In fact, this platform is based on a relational data model and offers the ability to aggregate and analyze data efficiently, making it easier to understand and interpret data, which can come from a variety of sources.
Looker Studio supports a wide range of data sources, including relational databases, data warehouses, Big Data, and cloud storage.Once the connection is established, we can start creating reports and dashboards, leveraging a wide range of tools and features. Among these, within Looker Studio we have the ability to create charts, tables, maps and more, customizing reports and dashboards to suit our needs, using filters, formats and layouts.
Trying to give examples, a company might use Looker Studio to analyze sales, costs or survey data; a website manager might use it to understand website visitor behavior, buying patterns or ad performance, while a social media manager might use it to show reach, engagement or conversions.
One of the main advantages of the platform is its ease of use: although it is a powerful application, it is intuitive and simple to use, even for users who are not business intelligence experts. It also offers a wide range of tools for customizing reports and dashboards, allowing you to tailor data visualizations to your specific needs.
Another significant advantage of Looker Studio is its ability to support collaboration: compared to other tools, reports and dashboards can be shared with other users, facilitating collaboration and information sharing within the organization. In addition, Looker Studio offers interactive controls that allow users to edit various chart contents, filter certain fields, or narrow the chart to display data in a selected date range.
Finally, Looker Studio can handle huge amounts of data, producing eye-catching charts that can help convey meaning in a way that raw data does not. However, it is important to remember that a well-crafted graph requires both accurate data and an appropriate type of graph: inaccurate data will not produce a graph that shows the truth, no matter how we display it, while good data embedded in a poorly chosen type of graph can confuse people.
The history of Google Looker Studio
Many people are still unfamiliar with the name Looker Studio, while they are a little more familiar with its functions.
In fact, this product was actually born in 2012, when Lloyd Tabb and Ben Porterfield founded the start-up Looker, which develops and markets the eponymous business intelligence platform for data exploration and discovery. Specifically, the tool is characterized by its use of LookML (a simple modeling language that allows data teams to define relationships in their database so that business users can explore, save, and download data with only a basic knowledge of SQL) and because it is the first commercially available business intelligence platform created and targeted at scalable or massively parallel relational database management systems, such as Amazon Redshift, Google BigQuery, HP Vertica, Netezza, and Teradata.
Recognizing Looker’s potential, Google decided in 2019 to acquire the company for $2.6 billion, initially integrating the product into its Google Cloud Platform (as a premium paid version) and continuing to work on expanding its capabilities and making it even more accessible.
Already in this “suite” was Google Data Studio, originally introduced in beta in mid-2016, which was more specifically a free Web-based data visualization tool that helped users create custom dashboards and easy-to-understand reports, specifically allowing them to track key KPIs for customers, visualize trends, and compare performance over time.
In 2022, Google decided to merge these tools and launch Looker Studio, which retains all the functionality of Google Data Studio while remaining a free product, and supports a wider range of data sources, offers more tools for creating reports and dashboards, and enables more secure and controlled report sharing.
One of the main differences between Looker Studio and Data Studio is the way data is modeled. Looker Studio uses LookML (Looker Modeling Language), a data modeling language specific to Looker, which allows for greater flexibility and accuracy in data analysis. In addition, the new platform has improved data fusion functionality: unlike Data Studio, which relied on a left external join, Looker Studio requires SQL databases to integrate any source. This makes it much easier to merge data from different sources, eliminating the need for manual imports and links to Google sheets.
How to use Google Looker Studio
All in all, Looker Studio is definitely a tool to consider and use if we are looking for a way to harness the power of data for our business, to check the outcomes of daily site optimization work, or to report more immediately on the results achieved.
The good news is that today Looker studio is free browser-based tool, so all you need to use it is a Google account, a data source and a desire to create a data visualization.
To get started, simply go to https://lookerstudio.google.com, log in to the account and then follow a simple procedure to connect a data source, create a chart (or use one of the templates already there), choose the most relevant metrics, refine the visualization, optionally add an interactive control and then share the report.
The first point is also the most important one: in order to use Looker Studio we need data, and indeed when we create a report the system first prompts us to select a data source from the hundreds of possibilities available, which include sources such as Google Analytics, Google Sheets, BigQuery, YouTube Analytics, Tables by Area 120, Microsoft SQL Server, MySQL or uploading a .csv file. In addition, we can also select one of more than 630 partner connectors to add data sources ranging from app analytics, advertising, social media and Web sites to accounting, customer relationship management, real estate and time tracking.
The integration with SEOZoom: how to input SEOZoom data into Looker Studio
Since a few days, to the list of available sources there is also SEOZoom! As requested by many users, in fact, the development team of our software has worked to enable the integration of the two platforms, and now it is therefore possible to create charts and reports in Looker Studio using SEOZoom data and metrics.
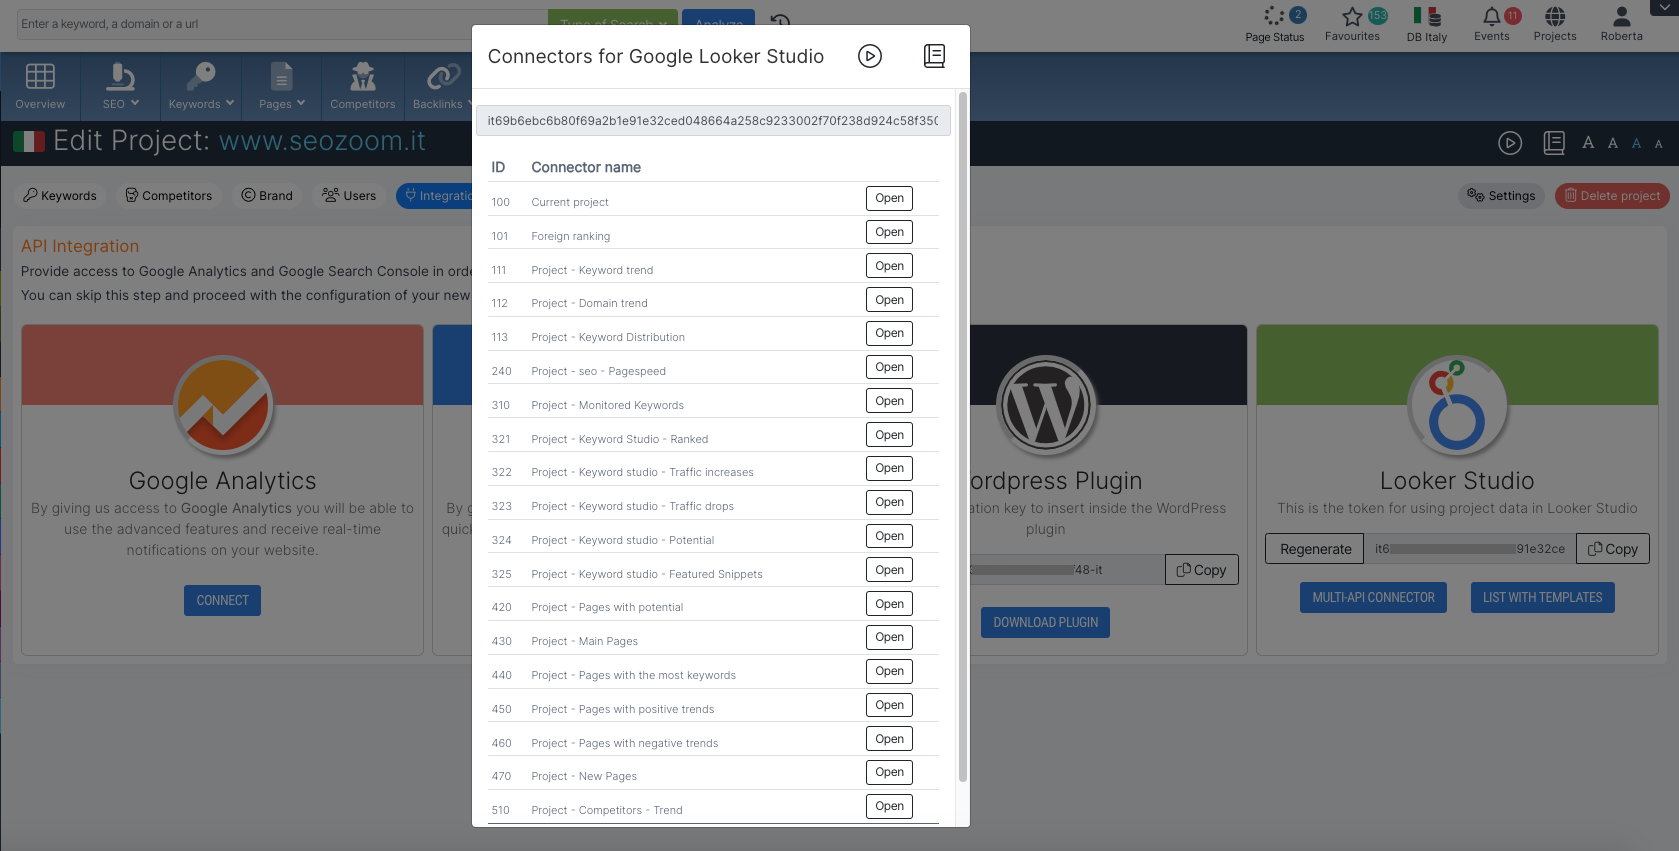
All we need is an active account and the creation of a project focused on the site we want to report on: from the project dashboard we enter the Edit tab and click on the Integration button. Here we’ll find the card for Looker Studio, where we can retrieve a token that allows the Looker Studio connector to “communicate” with SEOZoom and derive the required data, but also a handy file with a list of ready-made connectors, created to simplify and speed up the work of SEOZoom users by allowing them to take advantage of ready-made templates to be copied into a single Looker Studio report.
How to monitor Search Console data in Looker Studio
This product was also the focus of an episode of the YouTube Google Search Console Training series, in which Google’s Daniel Waisberg shared best practices for connecting Looker Studio and Search Console, and specifically for integrating GSC data within Looker Studio dashboards and reports.
The types of dashbords and the purpose of the survey
Before getting into diagrams and charts, the Google Search Advocate opens a parenthesis to introduce the topic of data visualizations on a higher level (data visualizations on a higher level), which, based on his experience, can be classified into three types of use cases and purposes.
- Monitoring Dashboards
Provides a way to quickly discover a change in data. For example, spikes or dips in page clicks and click-through rates for important pages on a website.
- Data Exploration
Helps uncover information from the data, such as by analyzing search performance patterns in different countries, devices, or sections of the website.
- Data survey
Helps discover trends and patterns from aggregated search data. For example, it can be useful to highlight to managers, customers, or the world how a specific industry or topic is performing.

Of course, this information can also be used in an integrated way: for example, the monitoring dashboard allows us to identify a problem, while exploring the data lets us find out what causes it or how to improve performance.
How to use monitoring dashboards
Waisberg focuses particularly on the first type of investigation, and then on monitoring dashboards, which can help us discover problems as they occur. Indeed, by and large, these dashboards are part of most people’s lives: a car dashboard reports key metrics to keep an eye on when we are behind the wheel, and a fitness app allows us to monitor exercise throughout the week.
All monitoring dashboards have one thing in common: they use simple visualizations, such as line or bar charts, that are easy to understand. Their goal is not to make us dive deep into the numbers, because monitoring is about observing the trend and quickly identifying any changes.
What is Looker Studio and how to create monitoring dashboards
The video then gets into the nitty-gritty by introducing Google’s Looker Studio tool, formerly known as Data Studio, which allows you to create customizable charts with just a few clicks, link data from multiple sources, and share results with your team.
Google Data Studio was introduced by Google on March 15, 2016 part of the Google Analytics 360 business suite, and the following year it was released as a free version for individual professionals and small teams.From its inception, it was designed as an online tool to convert data into customizable information reports and shareable dashboards.
More recently, in 2022, Data Studio became Looker Studio, while still retaining its basic features. Specifically, Looker Studio is a free tool that turns data into easy-to-read, easy-to-share, and fully customizable dashboards and information reports, with which you can, among other things:
- Visualize data in extensively customizable charts and tables.
- Easily connect different data sources.
- Share important information with the team or publicly.
- Collaborate with the team on reports.
- Speed up the process of creating reports using built-in sample reports.
Integrate Search Console data into Looker Studio dashboards
The first step in leveraging Google Search Console data as a source to feed Looker Studio reports is to find the monitoring dashboard template, which we will then link to our GSC data source.
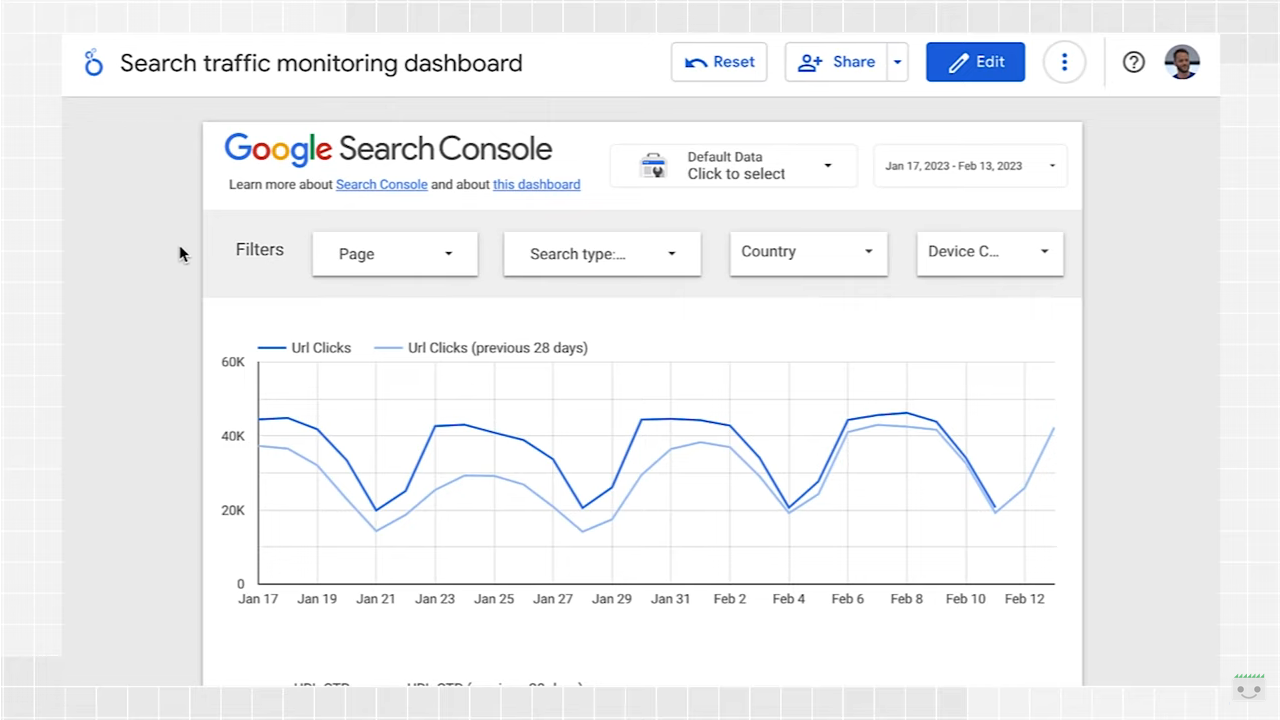
In the example shown by Waisberg, the dashboard has three main sections.
- First are the filters, which allow us to control the data displayed and the dates.
- Second, the line charts, which help us track clicks and CTR over time.
- And last, the table that delves into specific pages.
In the Filters section, we can also switch between the Search Console properties we have access to.
We can set the view by selecting a date range or one of the following options:
- Page
This is used to include or exclude one or more pages on our website. We can use regular expressions – regex – similarly to what we do in Search Console.
- Type
Allows us to choose from a variety of data types, including Discover and Google News functionality, with the option to set only one type at a time, however.
- Country
Allows you to include or exclude one or more countries/nations.
- Device
To choose one or more categories of devices to be tracked.
After filtering the data, line graphs will show how the metrics change over time. Waisber chose to look at clicks and click-through rate or CTR, and at a glance we immediately see that in the case at hand, weekend and weekday data have very different patterns.
It is a good practice, the Googler says, to always use a multiple of seven days in line graphs, paying particular attention to the days that come out of the pattern.
Charts are very useful in analyzing trends, but if we want to investigate further, it is more effective to analyze particular pages or groups using a table.
For example, we can use the page filter to include only specific sections of the website, the Country filter to check the performance of different pages in geographic areas that are relevant to the business, the type filter to analyze page-level performance for each of the data types.
Still, Looker Studio provides the data blending feature, which basically allows other data sources, such as website sections, country/regions, and budgets, to be added to the dashboard, thus creating charts, tables, and controls based on multiple data sources.
Adding other data sources to Looker Studio
From a practical standpoint, if we have a spreadsheet that maps all the pages to different sections of the website, we can load it into Looker Studio by creating a data source; the second step is to go to the search traffic monitoring dashboard and select the table.
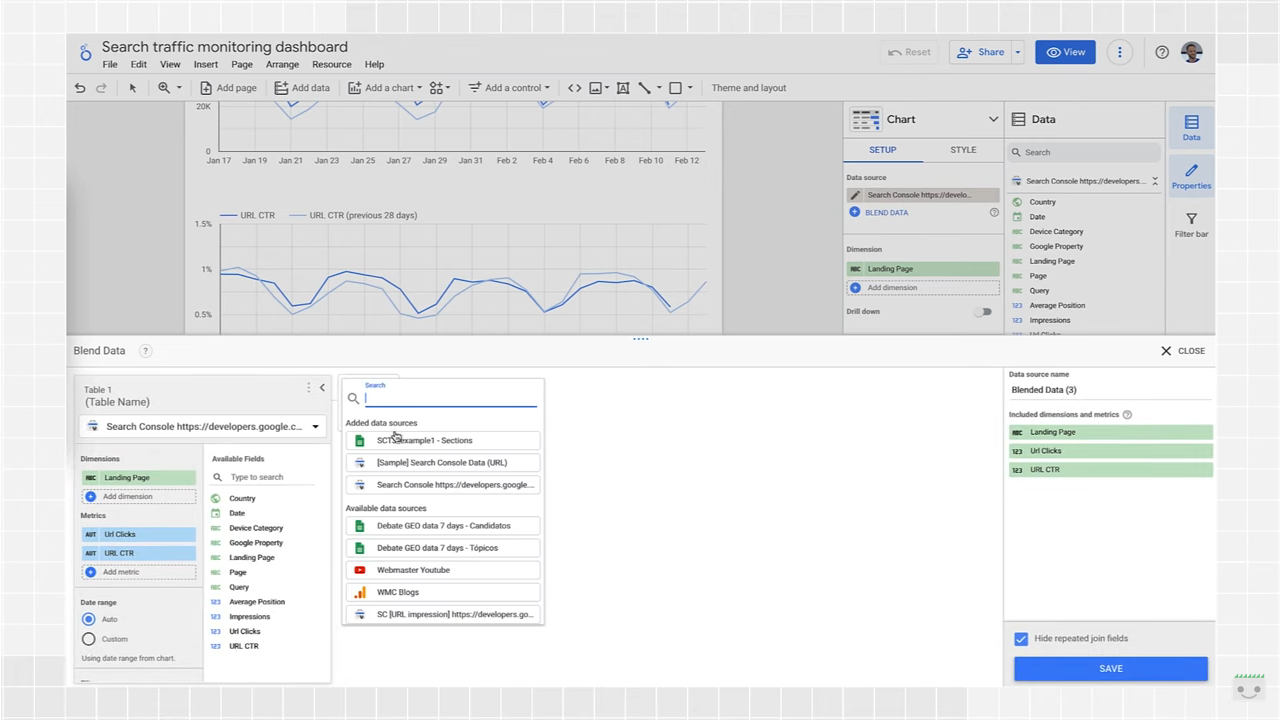
In the configuration menu, we will find at this point an option to join the data, with an interface that allows us to join the table to the data source we have loaded-with various possibilities for performing this join. In particular, Looker Studio supports the following join operators:
- Inner join: returns only the matching rows from the left and right tables.
- Left outer join: returns matching rows from the right table, plus non-matching rows from the left tables.
- Right outer join: returns matching rows from the left tables, plus non-matching rows from the right table.
- Full outer join: returns all matching rows from the left or right tables.
- Cross join: returns every possible combination of rows from the left and right tables.
In the video, Waisberg selects left outer join, which precisely returns matching rows from the right table plus non-matching rows from the left table. Continuing with the technical settings (enter the Section dimension in the appropriate box to make it available in the table configuration), we can then monitor key metrics by section on an ongoing basis.
We can do the same for multiple tables, so we can enrich the monitoring dashboards with information not available through Search Console.
In addition to page groups, we can also join clusters of queues, countries/regions, and others, because “the only limit is imagination.”