Core Web Vitals: what making visitors wait on your site actually costs you
Every wait on your site has a cost: Core Web Vitals show you where it starts and which pages to fix before customers head back to the search results
Have you ever pressed a button and seen nothing happen, then pressed it again just to be sure? Have you waited in front of a screen that stayed blank, or lost your place while reading because a banner pushed the text down? These are annoyances, frustrations, bad experiences that make you close the tab and go back to the search results.
The same happens to people who land on your site, and Google keeps track of it with Core Web Vitals, its grade for the experience you offer. These metrics lost momentum almost immediately, and now that AI is in the picture, they seem to matter even less: AI tools grab whatever they find on a page without clicking anything or waiting for it to load.
But the people who choose you still come to your site: to buy, to request a quote, to read something all the way through. And when they hit a slow load or a button that does nothing, they leave, just like they always have.
What Core Web Vitals are
Core Web Vitals are the metrics Google uses to judge the experience of using a web page: how fast its main content appears, how quickly it responds to input, how stable its elements stay as you browse. Each aspect has its own metric: Largest Contentful Paint (LCP) for loading, Interaction to Next Paint (INP) for responsiveness, Cumulative Layout Shift (CLS) for visual stability.
Open the page on your site that matters most, a product page or a contact form, on your phone and try using it. Largest Contentful Paint is the time you wait before the largest element in the visible part of the screen appears, usually the product photo or the headline. Interaction to Next Paint is the gap between tapping a size option or a field and seeing the screen respond. Cumulative Layout Shift measures how much the price and buttons move if a banner pops up above them while you’re looking at them.
If you only check how long the page takes to load, you miss what happens afterward: the cart button that responds with a half-second lag, the ad that pushes text down while the customer is reading. A page that loads in one second can still fail the assessment because of just one of these issues.

The evaluation is based on visits from people who actually use the site, day in and day out. Chrome records those times as people browse, and Google collects them from users who agreed to share usage data. If the site feels instant from your office computer, keep in mind the numbers also include people opening it on a budget phone over a weak mobile connection.
Core Web Vitals only record visits from people. Googlebot and the crawlers that OpenAI, Anthropic, and Perplexity use to feed ChatGPT, Claude, and Perplexity download pages without a browser ever showing them to anyone, so no time gets recorded. But when someone clicks on a source cited in one of those AI answers, they land on your site like any other visitor, and their wait time counts along with everyone else’s.
Why Google decided to measure visitor experience
PageSpeed Insights, Lighthouse, the Audits panel in Chrome DevTools, the speed report in Search Console, the Site Speed reports in Google Analytics, Test My Site. Until 2020, figuring out whether your site was fast, and where it wasn’t, meant checking each of these one by one. Each one answered with its own metrics: a score from 0 to 100, a speed index, an average load time, a classification of URLs as slow, average, or fast.
The same product page could score 40 in PageSpeed Insights and still get classified as “fast” in Search Console. At that point, you had to decide which number to trust, before you even figured out what to ask your developer.
An overabundance of metrics and tools created problems with priorities, clarity, and consistency, something Google itself acknowledged. The answer was a single set of guidelines, with a handful of metrics valid for every site, each with a threshold that tells you clearly whether a page is good or poor. That’s how Ilya Grigorik, at the time a Google engineer focused on web performance, explained it when he introduced Core Web Vitals in May 2020 on the Chromium blog, the open source project Chrome is built on.
Core Web Vitals also changed what you look at. Traditional metrics tracked technical events, like the load event, which the browser fires once it has downloaded every resource, including ad scripts. A page could be readable within two seconds and still take eight seconds to fire the load event, because of a widget buried at the bottom of the code. Or it could fire quickly and then freeze the moment a customer tapped something, while a script kept running in the background.
The new metrics track what the visitor actually sees on screen and what happens after they tap something. With a shared reference point like this, you can discuss the problem with developers, content teams, and sales using the same data and the same thresholds, and ask each of them something specific: which metric is failing, on which pages, since when.
The Core Web Vitals: LCP, INP, and CLS
The definitions of LCP, INP, and CLS are public and documented on web.dev, the site where the Chrome team explains web technologies, and every tool that calculates them, from Search Console to PageSpeed Insights to the libraries you can install on your site, applies the same rules. The documentation also covers the exclusions: which element can’t become the LCP, which gestures INP doesn’t count, which shifts CLS ignores.
- LCP. Largest Contentful Paint is the time between the start of navigation and the moment the browser renders the largest content element visible in the viewport, the portion of the screen visible before scrolling. That element can be an image, the first frame of a video, a background loaded from a stylesheet, or a block of text. On a product page, the logo and menu show up almost instantly, but for LCP the screen only counts as ready once the photo arrives, since it takes up more space than anything else. On an article with no header image, the counted element is often the title, and its timing depends mostly on fonts and stylesheets. The browser updates the candidate element every time it renders something bigger, and stops as soon as the visitor interacts: a tap, a keystroke, a scroll. Transparent elements, full-screen background layers, and low-quality placeholder images are excluded from the calculation. If your theme loads a blurred preview of the photo first, LCP only fires once the final version arrives.
- INP. The Interaction to Next Paint measures the latency between an interaction and the first screen update showing its effect. It counts clicks, taps, and key presses, physical or virtual, throughout the whole visit. Scrolling, hovering, and zooming don’t count. Between the tap on “add to cart” and the counter updating, the browser has to finish whatever work it’s doing, run the code tied to the button, and repaint the screen. If any of these steps takes too long, the customer taps again, sometimes adding the same product twice. A visit’s score is usually set by its slowest interaction. On an article page, one sluggish menu is enough to tank the score. On a catalog page, a filter that freezes every time you use it drags the score down, even if everything else responds instantly.
- CLS. Cumulative Layout Shift quantifies unexpected movements of visible elements, meaning position changes that happen without any action from the visitor. Each shift gets a score that multiplies the portion of the screen affected by the distance it moved, both expressed as a fraction of the viewport, which is why CLS is a unitless number. A block that moves from its starting to its ending position, covering three-quarters of the screen and dropping by a quarter of its height, produces a score of 0.1875, nearly double the threshold for a good score. Shifts triggered by the visitor don’t count: those that happen within half a second of a click or keypress, and animations built with the CSS
transformproperty, which move an element without pushing others around. If your dropdown menu pushes content down when you open it, CLS ignores it. If a cookie banner pops up on its own, CLS counts it.
Each metric has a threshold below which the experience is good and one above which it’s poor, with a “needs improvement” range in between. The thresholds apply to the 75th percentile of visits, meaning the value that three out of four visits meet.
| Metric | What the visitor experiences | Good | Poor |
|---|---|---|---|
| LCP | waits for the main content | up to 2.5 s | over 4 s |
| INP | taps, clicks, or types and waits for a response | up to 200 ms | over 500 ms |
| CLS | sees text and buttons shift around | up to 0.1 | over 0.25 |
Where the thresholds of 2.5 seconds, 200 milliseconds, and 0.1 come from
The Core Web Vitals thresholds follow a two-part criterion: each value had to describe an experience people consider good while also being already within reach for a good share of sites. Google laid this out in an analysis on web.dev.
For loading, the baseline comes from Card, Miller, and Newell’s studies on attention, which found that a response feels fast up to about 3 seconds. For responsiveness, there’s a 1962 experiment by psychologist Albert Michotte: under roughly 100 milliseconds, a gesture and its consequence feel like a single action. For stability there wasn’t prior research to draw on, so internal testing showed that shifts beyond 0.15 are consistently annoying.
The INP threshold is double the limit Michotte observed. With an INP of 180 milliseconds your page passes, but someone tapping a button can still notice the delay. If your site relies on filters, configurators, and carts, 200 milliseconds is the minimum you need to guarantee.
The thresholds are identical on mobile and desktop, because what people expect doesn’t depend on the device in their hand. What changes are the conditions: on a phone the processor is slower and the network less stable, so the same page has a harder time staying under the limit.
Why these metrics track the entire visit, and FID isn’t enough anymore
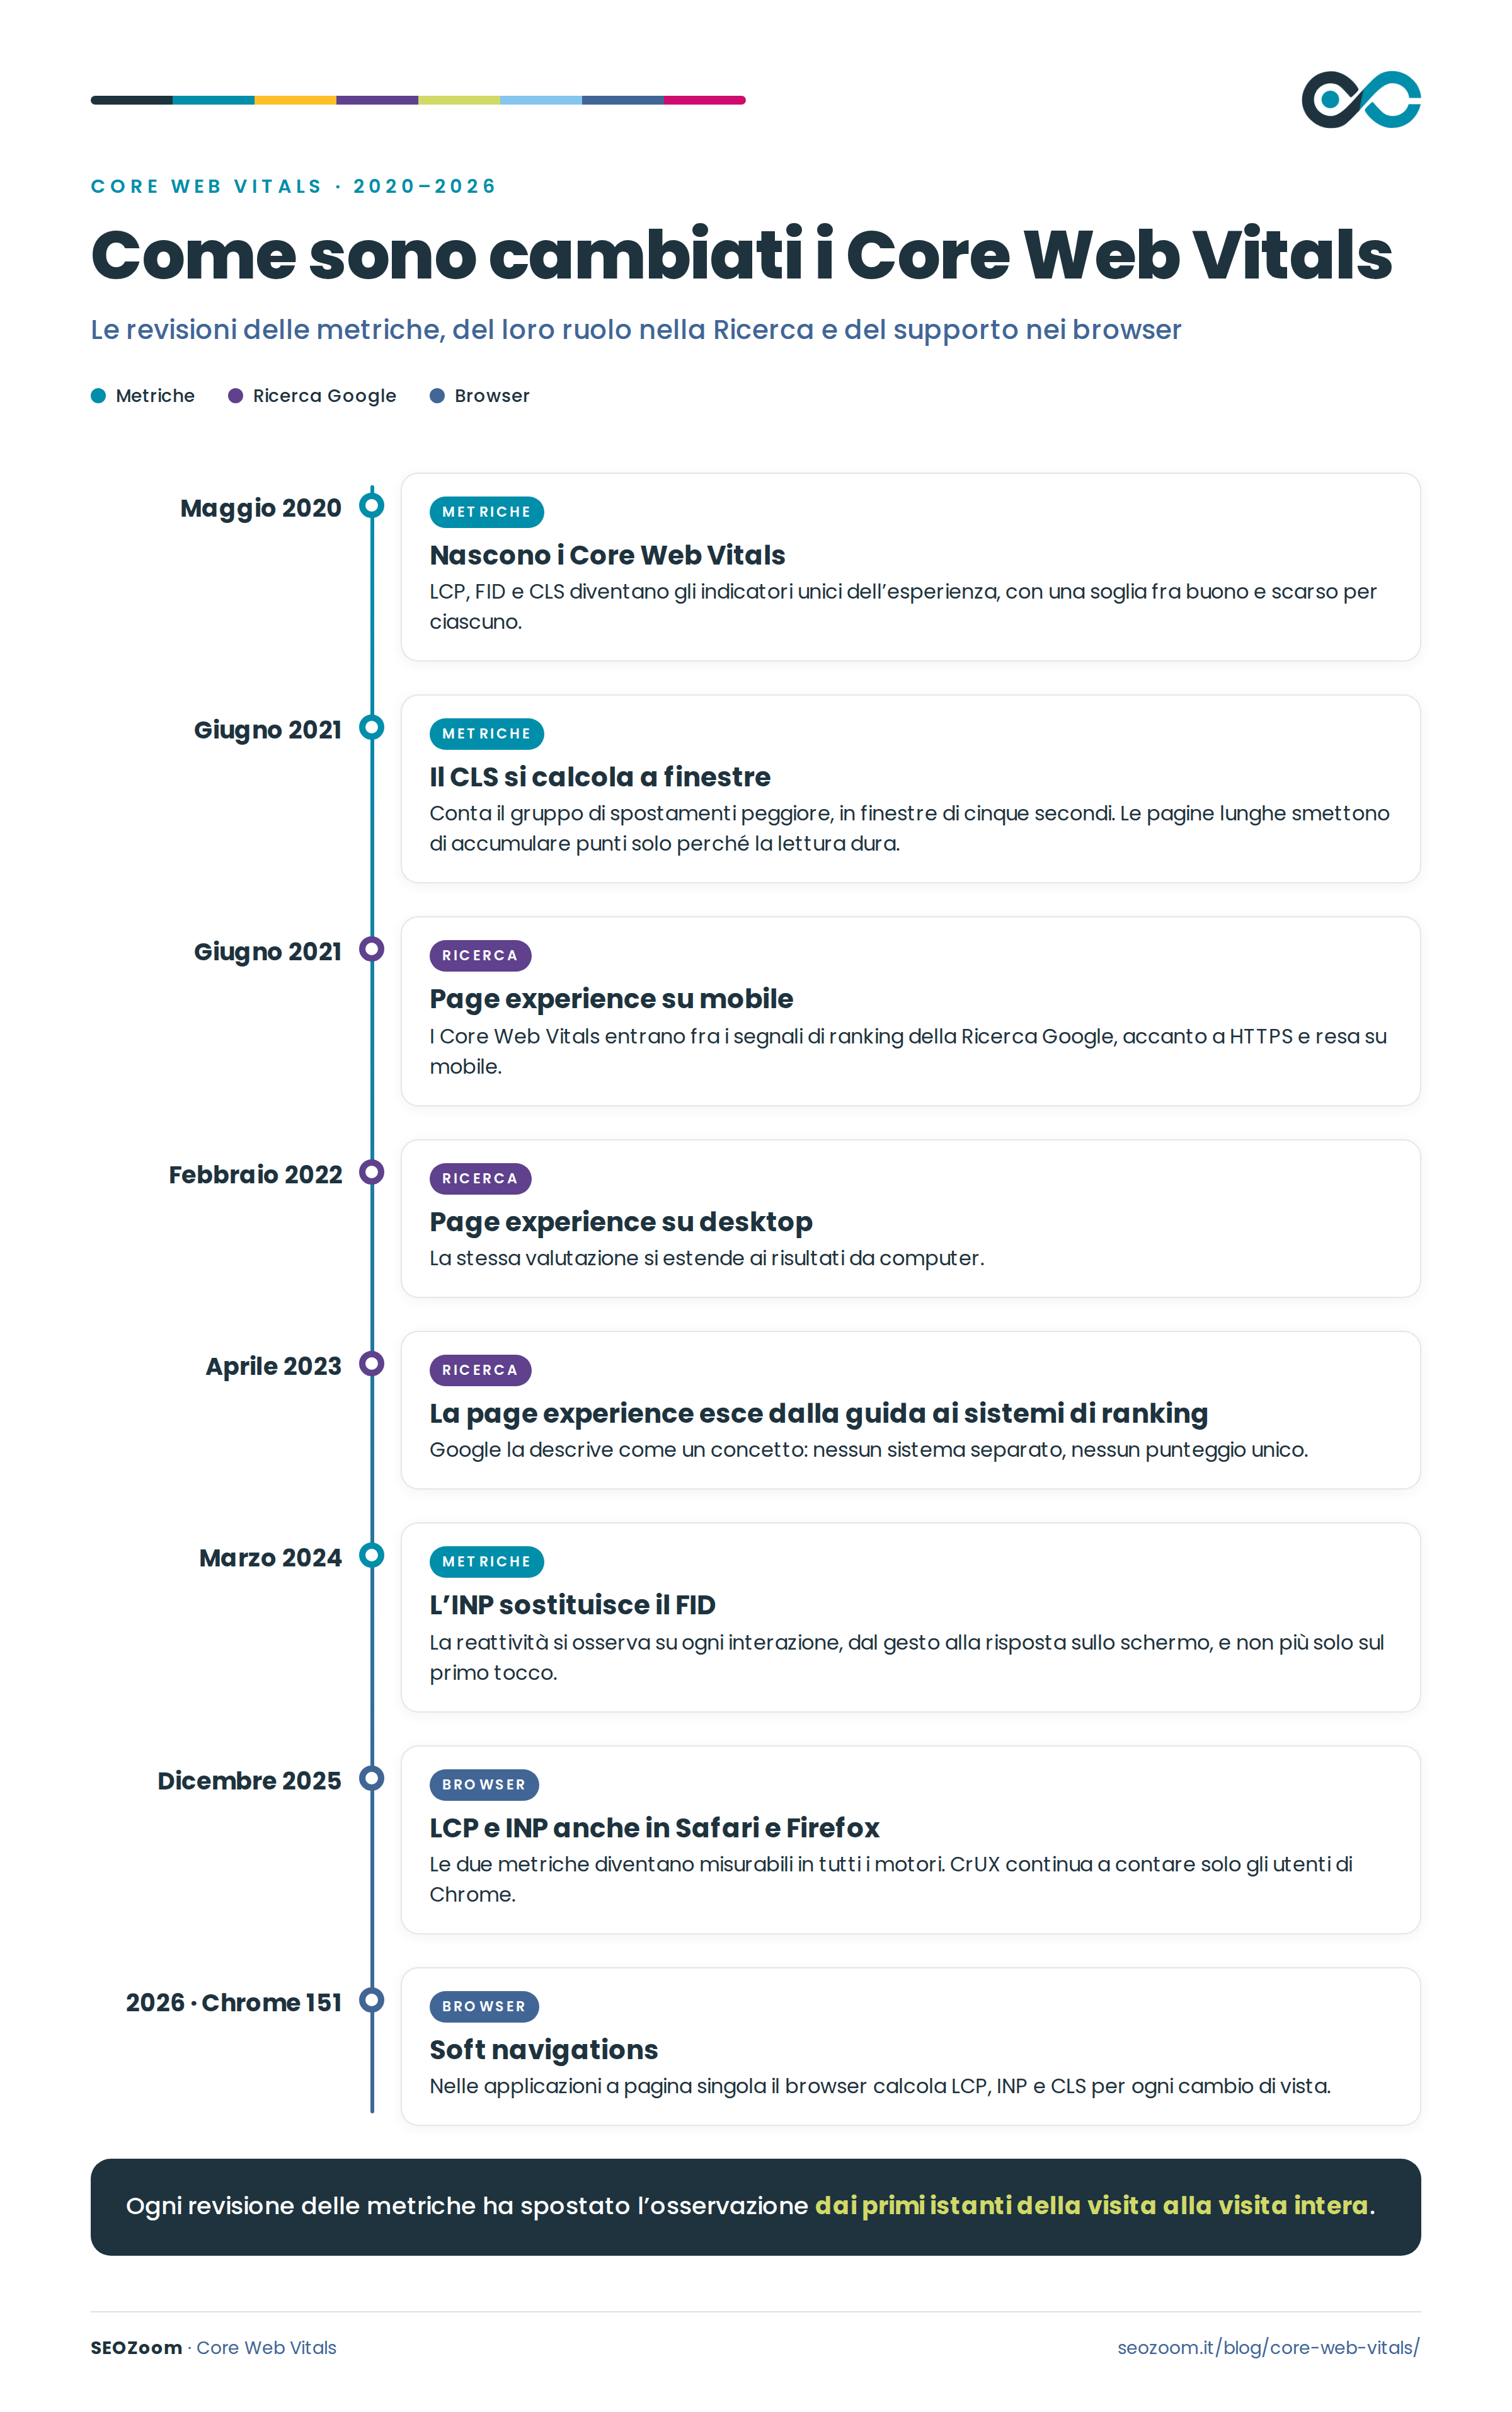
In 2020 the Core Web Vitals were LCP, CLS, and First Input Delay (FID), the delay before the first interaction, and Google had planned to review the list every year. The revisions have come less often than that, but all in the same direction, from the first moments of the visit to the whole visit.
In June 2021 the CLS calculation changed. Until then, every shift was added up for as long as the page stayed open, so a long article or an infinite-scroll page racked up points simply because people stuck around. With the new calculation, what counts is the worst cluster of shifts close together, measured in windows of five seconds or less.
On March 12, 2024, it was FID’s turn. It recorded only the wait before the browser started handling the first tap, ignoring everything after it: code execution, screen updates, every tap that followed. A page that was ready for the first gesture but froze on the third one still passed the check.
INP, which took its place, tracks every interaction from start to finish. The reasoning comes from a Chrome figure cited in the INP documentation: 90% of the time people spend on a page comes after it has loaded.
FID still turns up in guides written before 2024, in reports from tools that were never updated, and often in AI-generated answers, which still list LCP, FID, and CLS on this topic. If you come across advice for improving FID, you’re reading an outdated recommendation. And if an old report shows a good FID score, it still tells you nothing about how your pages actually respond.
Single-page applications, sites that change content and URL without reloading, have long been measured almost exclusively on the first page load. Starting with Chrome 151, the browser recognizes these view changes, called soft navigations, and calculates LCP, INP, and CLS for each one. How they’ll factor into the overall assessment hasn’t been announced yet.
How Google scores your site’s Core Web Vitals
In Search Console, the free service Google uses to show site owners how it sees their pages, the Core Web Vitals status appears in the Core Web Vitals report, which splits your site’s URLs into groups and rates each group as good, needs improvement, or poor, with separate charts for mobile and desktop.
That rating comes from field data, Chrome’s measurements of real visits, which Google compiles into the Chrome User Experience Report (CrUX), a public archive covering millions of sites.
The sample includes Chrome users who have turned on usage statistics reporting and history sync, per CrUX’s methodology. Left out are Safari, Firefox, Edge, apps that open links in their own in-app browsers, and even Chrome on iPhone, which runs on Safari’s engine.
If your mobile audience mostly uses iPhones, your mobile score is actually decided by your Android visits. If a lot of your customers arrive through a social app’s browser, their experience never enters the data.
The data covers a rolling 28-day window, updated daily: new visits come in, older ones drop out. The report you’re looking at reflects the last four weeks, and a change you published yesterday barely moves it.
For each metric, visits are ranked from best to worst, and the score is based on the 75th percentile, the value that three out of four visits meet. An LCP of 2.4 seconds at the 75th percentile means three out of four visitors saw the main content within that time, while the fourth waited longer.
With an average, the waits experienced by someone on a cheap phone would disappear behind the fast ones. With a percentile, they carry weight, and on many sites they represent a substantial share of the audience.
Mobile and desktop share the same thresholds but get separate scores, so a site can pass on computer and fail on phone with the same code. You only pass the assessment with LCP, INP, and CLS all good at once: a fast load doesn’t make up for a button that responds late.
Why PageSpeed Insights and Search Console give different verdicts
For the same page, on the same day, PageSpeed Insights can give a score of 95 while Search Console puts its group among the poor URLs. Both verdicts are correct, because they come from different observations.
At the top, PageSpeed Insights shows CrUX field data, for the page or the whole site. Further down is a score from 0 to 100 calculated by Lighthouse, a test that loads the page simulating a mid-range phone on mobile network, always under the same conditions.
That score belongs to lab data, produced by a simulated visit, and it’s the “90” that shows up in screenshots and proposals. It doesn’t enter into the Core Web Vitals assessment. Before you fix anything, it helps to understand where the gap between the score and the verdict comes from.
| What changes | Field data (CrUX, Search Console) | Lab data (Lighthouse) |
|---|---|---|
| Where it comes from | real visits from Chrome users | a simulated visit |
| Device and network | visitors’ actual devices | emulated mid-range phone, fixed mobile network |
| Time frame | last 28 days | the moment of the test |
| Responsiveness | INP, across the entire visit | TBT, only during loading |
| Redirects and connection | included in LCP | skipped, if the test starts from the final URL |
| Scope | groups of URLs, a page, or the whole site | only the URL entered |
| After a fix | weeks to update | immediate |
| Factors into the score | yes | no |
Total Blocking Time (TBT) is the time during loading when the browser stays tied up in tasks so long it can’t respond to a tap. In the lab nobody touches anything, so INP can’t be calculated, and TBT stands in as a proxy, without being equivalent to it.
To see how far your real audience strays from the simulated phone, check the device breakdown of your visits in Google Analytics.
The lab score also shifts from one run to the next, due to the network and the machine running the test: a few extra points on the second attempt still describe the same page. The lab is good for something else. It lets you reproduce an issue whenever you want, see which element the browser picked as LCP and which script blocked it, and compare a page before and after a change without waiting a month for traffic.
URL groups and origin-level data: when a page inherits the score
In the Core Web Vitals report a group bundles URLs with a similar experience, usually built on the same template, and takes the status of its worst metric: with a poor CLS and a good INP, the group ends up among the poor URLs.
Opening a group shows you a few example URLs. They’re there to help you recognize the template, since fixing the first one on the list won’t change the status of a set that can include hundreds of URLs.
A page only gets its own data if it receives enough visits from Chrome users over 28 days, and the threshold isn’t disclosed. A niche product page or a just-published article can fall short of it. In that case PageSpeed Insights shows the origin data instead, meaning the whole site identified by protocol, domain, and port, and flags it above the field data: that’s the first thing to check.
Origin data misleads in both directions. A slow page looks good because the rest of the site is fast, so you leave it as is while its visitors keep waiting. A lightweight page inherits the poor INP of a configurator living elsewhere, sending you off to chase a problem it doesn’t have.
When the score changes without you touching the site
A fix published yesterday won’t change tomorrow’s Search Console report, because the data covers the last four weeks of visits. The group stays among the poor URLs until visits to the old version drop out of the count. A regression shows up late too, often weeks after customers started waiting.
The score shifts even without code changes, when who’s arriving changes. A social media campaign brings in visits from slower phones and mobile networks, and LCP goes up.
AI-generated answers change who arrives too. When an informational search gets resolved inside an AI Overview, the summary Google shows above the results, or in an assistant like ChatGPT, the page that used to live off that traffic gets fewer visitors, with different devices and habits. If visits drop enough, the page loses its own data and falls back to origin data. No public metric tells you how much this shifts the numbers.
Before crediting a change to something you did, compare the Core Web Vitals trend against audience composition in Google Analytics, by device and by channel. If the curves move together, it’s the audience that changed, not your fix.
The weight of Core Web Vitals in Search and in AI answers
Since June 2021, Core Web Vitals have been part of the signals Google Search uses to rank results. They arrived with the page experience update, which paired them with other aspects of page experience, like HTTPS and mobile rendering, first on mobile devices and from 2022 on desktop too. The scaling back started almost right away, and Google itself carried it forward, document after document.
The page experience documentation confirms them among the signals used and immediately limits their role. There’s no single experience signal, the most relevant content still gets shown even when the experience is poor, and a good experience only helps when there are many useful pieces of content that are otherwise equivalent.
If your page answers worse than the ones ranking above it, pushing your metrics under the threshold won’t give it the relevance it’s missing. If it answers better, it stays put even with a poor experience. Core Web Vitals work on the margin between equivalent answers.
For years, page experience was read as a standalone ranking factor, bundling Core Web Vitals, HTTPS, mobile rendering, and the absence of intrusive interstitials, the pop-ups that cover the content on open. Until April 2023 it even showed up as its own system in Google’s guide to ranking systems.
When it removed it from that guide, Google clarified that it was a concept, a way to flag the aspects worth taking care of, with no separate system and no single score. If someone explains a drop with a “page experience update,” they’re pointing you to a system that doesn’t exist.
“Not giant factors in ranking,” John Mueller called them in October 2024. He handles Google’s dialogue with site owners and SEOs, and added that he doubts a steep drop can come down to these alone. Failing the assessment doesn’t exclude you from the results, and passing it doesn’t guarantee you a position.
AI Overviews and AI Mode, the answers generated inside Search, pick sources from pages already in the index. The requirement, according to the documentation on AI features, is that the page be indexed and eligible to show a snippet, with no additional technical requirements.
Core Web Vitals reach those answers through the same path as classic results, carrying just as little weight. A relevant page with a poor LCP can still become a source, while a page with perfect metrics and a weak answer gets left out.
Once someone clicks the source and opens the page, experience counts in full again. The guide to optimizing for generative AI, updated by Google in July 2026, explicitly asks for a good experience for visitors, with low latency and a recognizable main content. Whoever opens your page from a citation has already picked you over the other sources offered, and making them wait is the fastest way to lose them.
Figuring out if experience can make a difference for your queries
The Search Console report tells you how your own pages are doing and nothing about the pages you’re competing with. To figure out whether experience can move the needle on a query, start from the results: search the query and open the pages above and below yours.
Compare the answers first. Do the pages above cover the question in full? Do they offer data, examples, or steps you don’t have? Are they more up to date? If so, the gap is in content, and no amount of performance work will close it.
If the answers are on par, compare the experience. PageSpeed Insights accepts any URL, including a competitor’s, and shows its field data when available. In a few minutes you can see whether the pages ranking near yours offer a better mobile LCP or INP.
Good competitors and a weak page of yours, on a query that’s otherwise balanced, is the case where improving can actually shift rankings. If everyone’s weak, nobody gains a ranking edge from it, but whoever improves first gives visitors a better experience.
A ranking drop over a few days rarely comes down to Core Web Vitals, which change slowly because of the 28-day window. It more often lines up with an algorithm update, a new competitor showing up, or a crawling and indexing issue.
What matters about your page when an AI system reads it
AI crawlers, like OpenAI’s GPTBot, Anthropic’s ClaudeBot, and PerplexityBot, request the page from the server and read its content without ever opening it in front of anyone: no image to wait for, no button to tap, no line that shifts around. Their visit produces no LCP, INP, or CLS values, and the same goes for Googlebot when it’s gathering the pages that feed AI Overviews and AI Mode.
Of site speed, crawlers only pick up on the part that depends on the server: response times, errors, timeouts, redirect chains. If the server slows down or responds with errors, the documentation on crawl budget warns, Googlebot crawls less.
Time to First Byte (TTFB), the time the server takes to send the first byte of the page, matters to both kinds of readers. No documentation ties it to source selection, but it affects crawling, and for visitors it’s the first stage of LCP: if the server responds late, everything else starts late too.
JavaScript, on the other hand, splits crawlers into two camps. A Vercel and MERJ analysis of real traffic, from December 2024, showed that OpenAI’s, Anthropic’s, and Perplexity’s crawlers download JavaScript files without executing them, while Gemini, which runs on Googlebot’s infrastructure, and AppleBot do execute them. Text that only appears after the code runs simply doesn’t exist for the first group.
The choices that make content readable to those crawlers also help your visitors. A main image and text already present in the HTML the server sends get found sooner by the browser, which shortens LCP. Less JavaScript to execute leaves the browser free to respond to interactions, which brings INP down.
If you want to check what actually reaches crawlers and which rendering choices decide that, the guide to technical SEO is the place to go. If you want to understand why a readable passage gets cited or not, that’s the territory of SEO for AI.
Which pages are worth working on
Work on Core Web Vitals pays off where people actually land and where what they experience changes what they do: buying, requesting a quote, signing up, coming back. On a page nobody visits, improving the metrics moves a number and nothing else.
Start from the pages that get visits, because only there does field data exist to improve, along with a way to verify the fix. You’ll find them in Search Console’s page performance report and among Google Analytics’ landing pages. In SEOZoom’s Project, with Search Console connected, the Pages Performance view lists every tracked URL with clicks, impressions, CTR, average position, and keyword count, showing in a single table which URLs actually get visitors.
Among those URLs you’ll also find the landing pages people reach by clicking a source in a generated answer. In Google Analytics 4 they show up as referrals from chatgpt.com or perplexity.ai, and they often don’t match the pages you’ve put the most work into: an old technical article can get more visits from AI than your most polished content.
The page type tells you which metric to prioritize. On an article, what matters is the content arriving and staying stable while people read, so LCP and CLS are the ones to watch, and ads and embeds are often behind the shifts. On a product page, a filtered listing, a quote form, or a cart, INP matters most, because a filter that responds late slows the customer down right when they’re deciding.
| Page type | Metric to check first | Where the problem usually starts |
|---|---|---|
| Article | LCP, CLS | header image or title arriving late; ads and embeds that push text around |
| Product page | INP, LCP | variant and size selection; photo gallery; review scripts |
| Filtered listing page | INP | filters that recalculate and redraw the entire list |
| Quote or contact form | INP | field validation while typing; tracking scripts |
| Cart and checkout | INP, CLS | total updates; alerts and banners that appear above buttons |
In the same remarks where he downplayed the weight of Core Web Vitals in rankings, Mueller pointed to this exact issue. If people get frustrated enough that they don’t want to come back, he wrote, “you’re just wasting the first-time visitors to your site, regardless of where they come from.”
Some drops call for a different fix, and spotting which is which saves you weeks of wasted work. A page losing rankings because it answers the query worse than competitors needs work on the content. A page losing clicks because its query gets answered in an AI Overview won’t win them back by loading faster. A page that arrives nearly empty to crawlers that don’t run JavaScript has a rendering problem.
Templates and groups: where one fix reaches multiple pages
In the Core Web Vitals report, mobile and desktop sit in two separate sections, and you need to read both, since the scores are separate. On mobile, the poor groups are usually more numerous and larger.
The example URLs in a group tell you which template makes it up. Addresses with the same structure, like product pages or blog posts, point to a template, the page type the site uses to generate every page of that kind.
If a group mixes different templates, open several examples and look for what they share. Often it’s a script, a banner, or a widget present across all of them.
A template problem gets fixed once, in the template itself, and the fix then applies to every page that uses it. Working address by address barely moves the needle, since the group’s status depends on hundreds of URLs.
Between two templates with the same problem, fix the one that sells or collects leads first. If the role is the same, pick the one with more visits: the fix reaches more people and gives you field data to verify it sooner.
Hand-built landing pages for a campaign and pages with few visits fall outside this logic, since they don’t form groups or don’t have data of their own. For these, work with the lab tool and with direct visit tracking instead.
Measuring what a wait actually costs you
CrUX tells you whether you pass the assessment, and nothing about what a four-second LCP costs you on the quote page. To find that out, you need to track visits on your own site and compare them against what people actually do.
The web-vitals library, maintained by the Chrome team, weighs about 3 KB and calculates LCP, INP, and CLS the same way Chrome does, on every visit and every page, including the ones CrUX doesn’t cover. The attribution build adds where the time was lost: the LCP phase that weighed the most, the slow interaction and the script behind it, the element that shifted.
The data gets sent to Google Analytics 4 as events, tied to the page and the visit. From there, you can compare the conversion rate of visits with good LCP or INP against visits with poor values, on the same page or across the pages of a template.
A sharp difference gives you an estimate of what the wait costs you. A negligible difference tells you your time is better spent elsewhere.
You need to isolate the device effect in the comparison. Slow visits often come from cheap phones and weak networks, and the people using them may convert less for reasons that have nothing to do with the wait. If you compare visits from the same device type and the slow ones still convert less, you’re looking at the real cost of the wait.
The numbers won’t match CrUX. Since December 2025, LCP and INP can also be measured in Safari and Firefox, and the library collects them from your entire audience, while CrUX still counts only Chrome users, as web.dev has confirmed. CLS remains limited to Chromium-based browsers.
For visits from iPhones, it’s the only data you have. To compare it with Google’s assessment, calculate the 75th percentile yourself too.
How to improve your Core Web Vitals
To improve Core Web Vitals, start with field data, which tells you where the experience breaks down and on which metric, move to the lab, which shows you what’s slowing the page down, then go back to the field to see whether people have stopped waiting. If you start from the lab, you risk spending days polishing the score of a page that’s already fine for visitors.
The first question to ask the field data is how long the problem has existed. CrUX Vis, Chrome’s free tool that turns CrUX data into charts, shows the weekly trend for the last 40 weeks, and you can get the same history as raw data through the CrUX History API. A precise start date, checked against your release history, narrows down the search for the cause considerably.
On a site built with a CMS, most of what the browser has to download and run depends on the theme, the plugins, the page builders, and the scripts added over the years. On WordPress as on Shopify, the fix usually comes from replacing or reconfiguring one of these pieces rather than rewriting code.
Hosting and CDN, the networks that deliver content from servers close to the visitor, determine the TTFB instead, which is where every page load starts. A slow server slows down every page on the site, no matter the template.
You can handle some fixes yourself: declare image dimensions, remove lazy loading from the main image, strip out unnecessary plugins and scripts, enable caching and a CDN. Others require a developer, like breaking up long tasks in the theme’s code, moving page generation to the server, or rewriting a component that recalculates the layout on every tap. Knowing which metric is failing, and why, tells you what to ask for.
Tracing a poor metric back to its cause
In the Search Console report, each issue is labeled with the metric and the threshold it exceeded, for example an LCP above 2.5 seconds on mobile. Read this first, because LCP, INP, and CLS degrade for different reasons, and each one shows up in a different part of the page. The table below reflects the causes that web.dev’s priority recommendations focus on.
| Metric | Causes to look for | Where to check |
|---|---|---|
| LCP | slow server; main image injected by a script; main image lazy-loaded or without priority; CSS, fonts, and scripts that block rendering | LCP phases with web-vitals or in the Performance panel; LCP element in PageSpeed Insights diagnostics; HTML source |
| INP | long tasks that occupy the browser; unnecessary JavaScript, including third-party tags and scripts; heavy updates on a page with lots of elements | slow interaction and the script responsible, via web-vitals; recording in the Performance panel while you perform the action; TBT, as a clue only |
| CLS | images, iframes, and embeds without set dimensions; banners and ads inserted above the content; fonts that change size on load; animations on layout properties; pages excluded from the back/forward cache | element that shifted, according to web-vitals; PageSpeed Insights diagnostics; recording in the Performance panel, including while scrolling |
With a poor LCP, you need to figure out where in the process time is being lost. The LCP optimization guide breaks the wait down into server response time, the delay before the main image starts downloading, the download itself, and the wait before the browser renders it. On a well-built page, server response and download each take about 40%, and every other delay stays under 10%.
On sites with poor LCP, time is lost mostly before the download starts, which according to web.dev should take up less than 10% of the wait. In 35% of cases, the main image doesn’t even appear in the initial HTML, because a script inserts it. Only 15% of pages that could use the fetchpriority attribute actually use it.
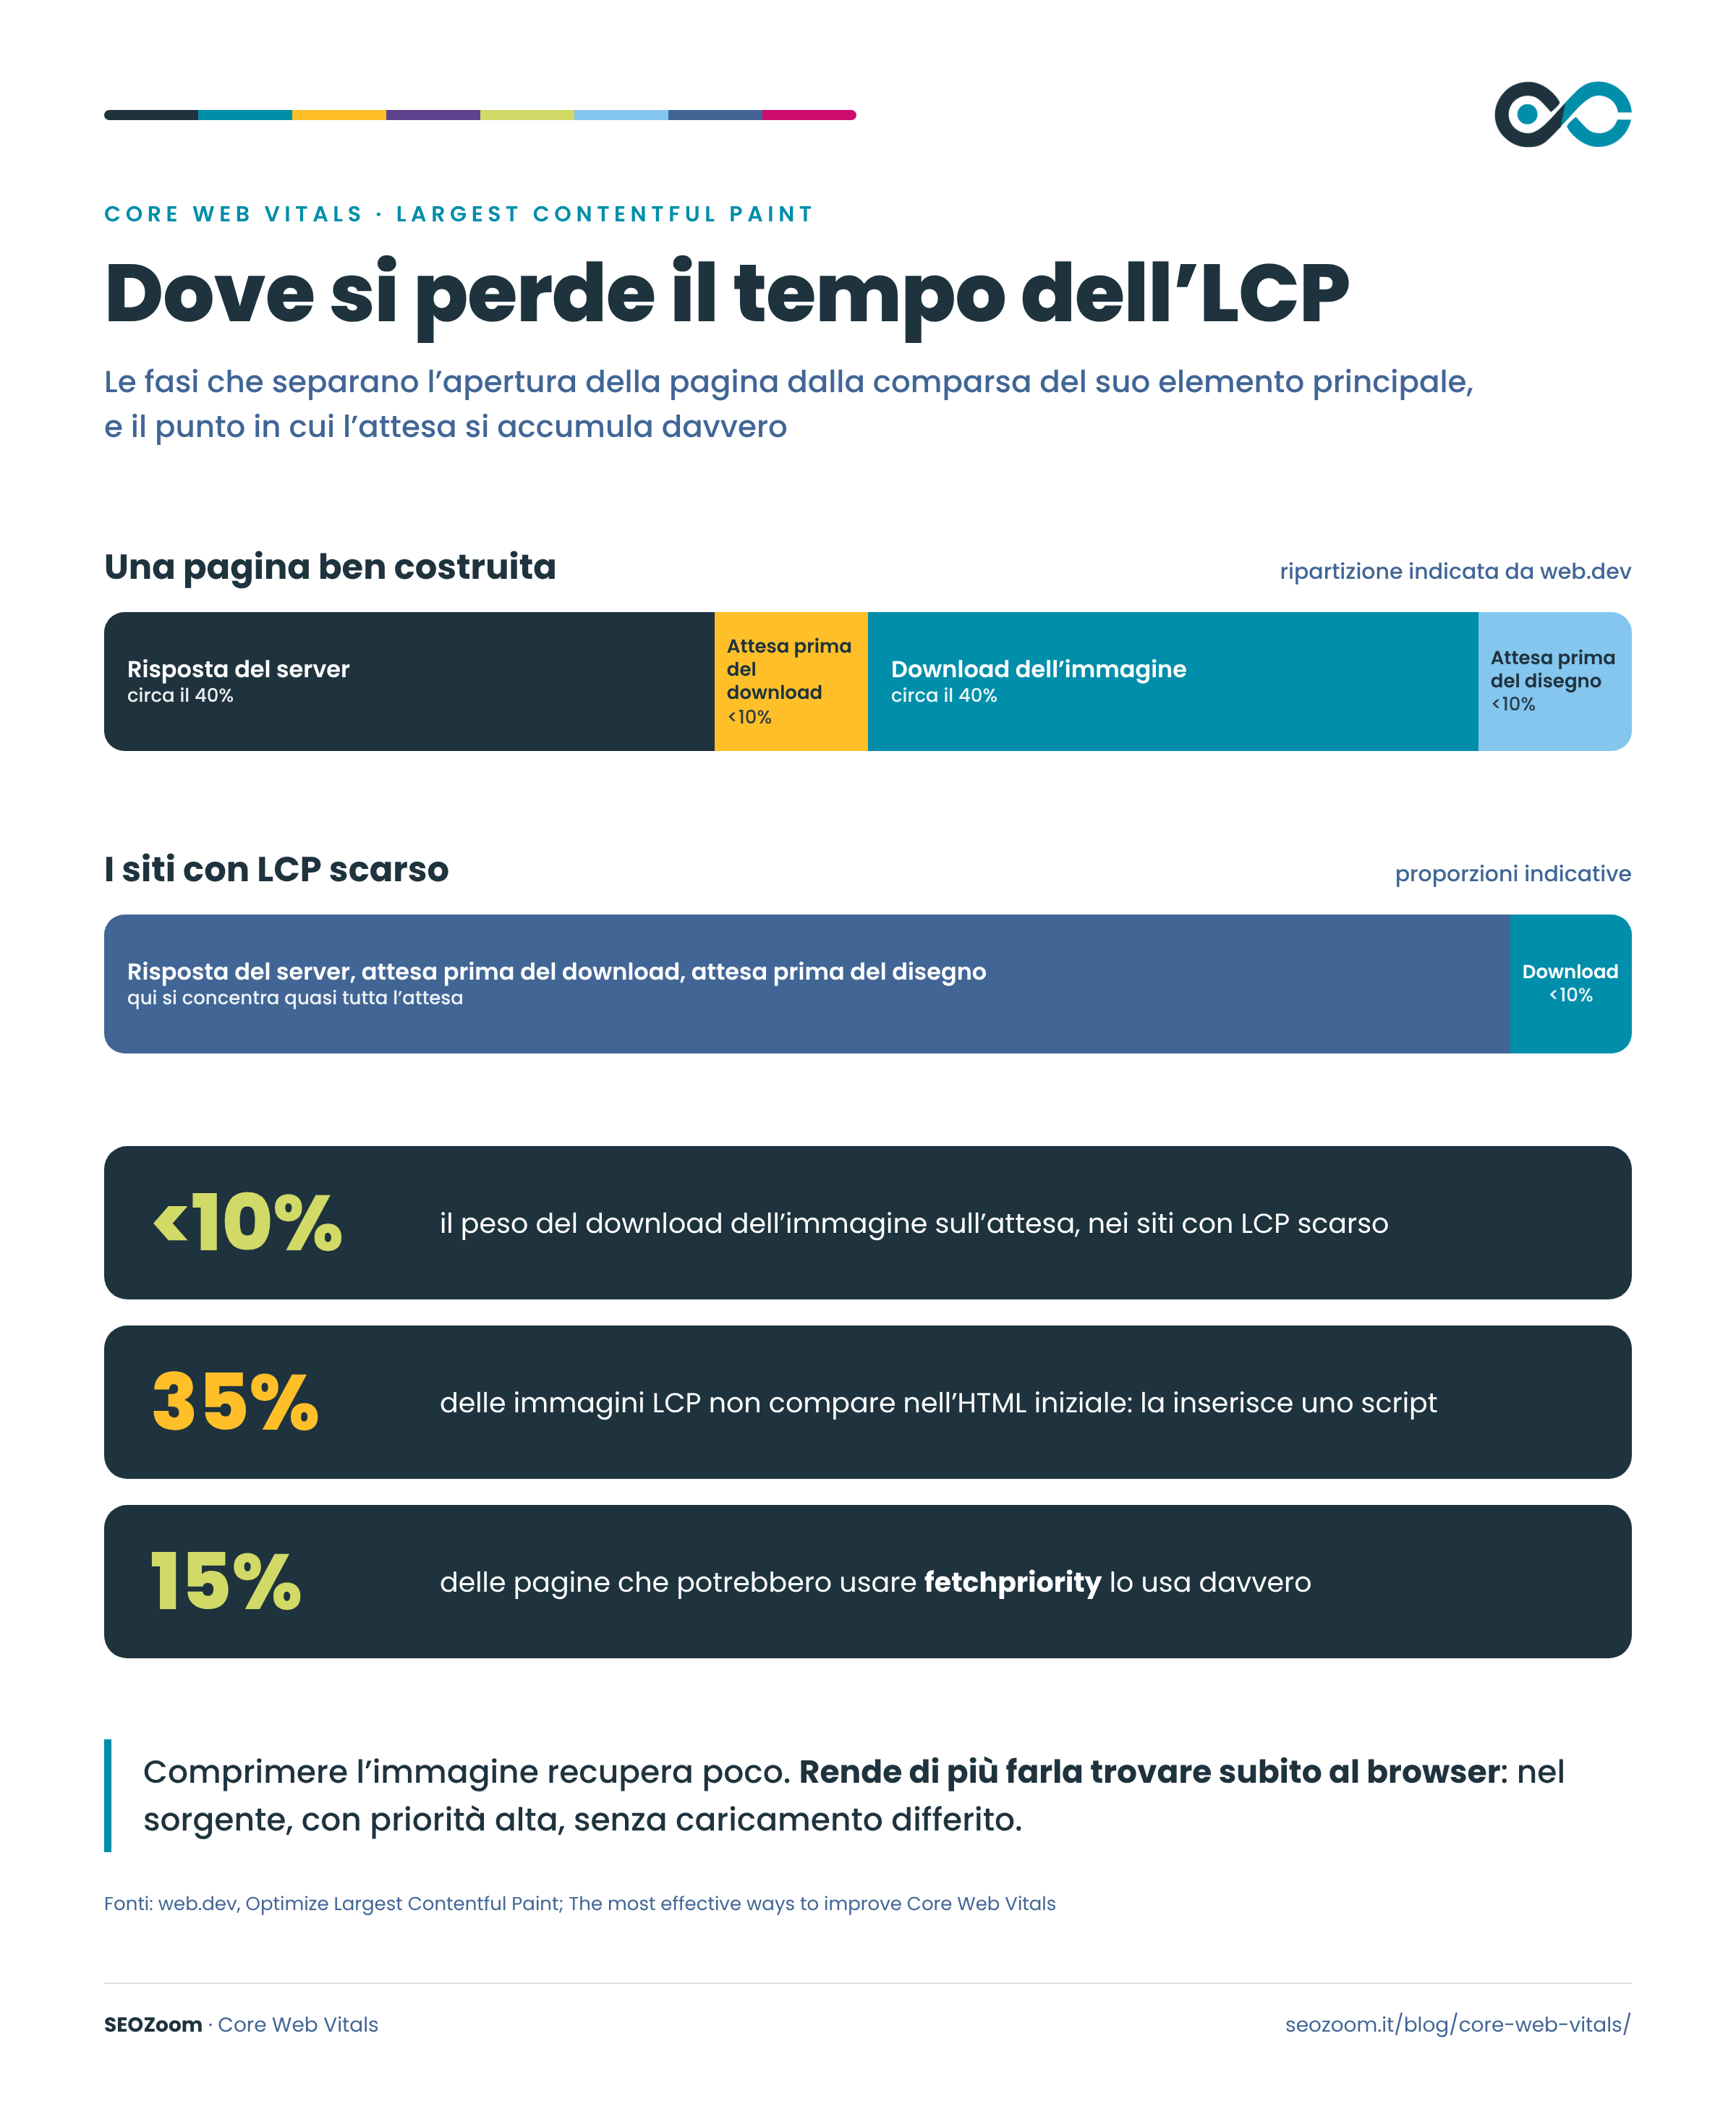
Compressing the image, the first fix that comes to mind, often does little. You get more out of putting it in the page’s source code, giving it priority with fetchpriority="high" or with a preload, and removing the loading="lazy", which by design pushes it to the back of the queue. Format and file size come after that, and you can find them in the guide on how to optimize images.
If the wait is instead caused by server response time, the fix is on hosting, caching, and CDN: no amount of work on the image will make up for time lost before the page even arrives.
With a poor INP, you first need to find out which interaction is causing the delay, and the attribution build of web-vitals will tell you that along with the phase and the script responsible. Without that data, start from the gestures people actually use on the template: opening the menu, picking a variant, applying a filter, adding to cart.
According to the INP optimization guide, every interaction breaks down into input delay, processing time, and presentation delay, and each phase gets fixed differently. A long input delay points to a browser that’s already busy, often with third-party scripts loaded at the wrong time.
Long processing time calls for breaking up the code tied to the gesture and deferring anything that isn’t needed to show the response. Slow presentation delay points to a page with too many elements, or a layout the browser has to recalculate on every tap.
With a poor CLS, the most effective fix is reserving space before the content arrives. According to web.dev, 66% of pages have at least one image without declared dimensions: declaring them, and reserving space in the stylesheet for ads and embeds, removes the most common cause.
Fonts should load with a fallback typeface of similar size, so the text doesn’t change dimensions when the final font arrives. Animations should be built with transform, which moves an element without pushing others around.
The browser’s back/forward cache keeps a page in memory when you leave it and restores it instantly when you hit the back button. A page restored this way starts with zero CLS, and the rollout of this cache was the single biggest CLS improvement on the web in 2022. Many sites are locked out of it due to technical choices, like certain scripts or cache headers, and PageSpeed Insights will tell you which ones.
Reproduce the problem in the Performance panel
The Performance panel in Chrome DevTools lets you watch the cause as it happens. From the sample URLs, pick a page that represents the template: a product page with photos, variants, and reviews like the others, not the one with the shortest description.
Open the page in Chrome, launch DevTools with F12, and switch to the Performance panel. You’ll immediately see the LCP and CLS values for that load and the INP of the interactions you perform, and according to the DevTools documentation, you can compare them against CrUX field data for the same page.
On your own computer the problem often doesn’t show up, because your processor runs the code much faster than a phone’s would. Before recording, throttle CPU and network in the capture settings, so the simulation gets closer to what visitors actually experience.
Record a page load and watch the trace to see when the request for the main element starts, how long it waits before appearing, what’s keeping the browser busy in the meantime, and which element pushes the others around.
For INP, you perform the gesture yourself. With the page already loaded, start a recording without reloading, do what people typically do on that template, then stop it. In the trace you’ll find each interaction with its duration and, below it, the work done between the tap and the screen update: the code tied to the gesture, the third-party script that got in the way, the layout recalculation. If that gesture responds quickly, move on to the next one.
Verify fixes and catch regressions
Test a fix before publishing it, in a staging environment, a copy of the site you work on without exposing it to visitors. Field data won’t be available there, but lab testing works fine: same template, same conditions, multiple runs before and after the change. Watch the value of the metric you’re trying to improve more than the overall score, which fluctuates on its own.
After the release, open the issue you worked on in the Core Web Vitals report and start validation. Search Console watches the pages in the group for 28 days, the length of the CrUX window, and the group improves gradually, as visits to the new version replace visits to the old one.
A week after release the group can still show as poor even if the fix works. In the meantime, CrUX Vis shows you the trend week by week, and web-vitals shows it day by day.
A regression shows up in the report with the same delay as a fix. A theme update, a new plugin, or a marketing script added to a template can ruin the experience from day one, while the group still shows among the good URLs for weeks. If you’ve published other changes in the meantime, figuring out which one caused the damage becomes a backward investigation.
To catch a regression early, you need a lab test run regularly on the templates that matter, always under the same conditions, with results kept on file. In the SEOZoom Project, the Core Web Vitals section does this: it runs Lighthouse on the homepage and up to five templates, on desktop and mobile, and keeps a history of the scores, so you can see the day a template’s trend changed.
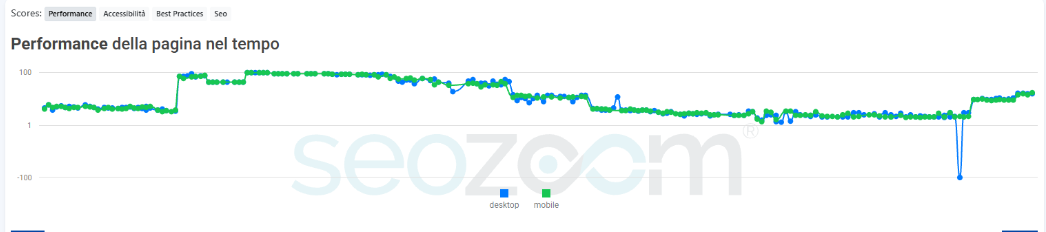
Next to each reading you’ll find the lab metrics, from Largest Contentful Paint to Cumulative Layout Shift, and responsiveness through TBT, since INP doesn’t exist in a lab setting. You read each value against its own history: a jump after a release tells you which template to check and from which day. You confirm it with a few runs in PageSpeed Insights and the Performance panel, and in the end you verify its effect on real people through field data.
Core Web Vitals tell you what happens after the choice: once someone has found your page in a search result, in a generated answer, or in a shared link, and decided to open it. They tell you whether it appeared in time, whether it responded to their actions, whether it stayed still while they were reading.
That part of the journey happens on your site, and it’s the part you have the most direct control over. If sales, contacts, and sign-ups come from those visits, the Core Web Vitals report shows you where you’re losing them.


 Verified reviews on Trustpilot