SEOZoom Observatory: monitor both SERPs and sites at all times
In the work of site optimization, one of the keys to achieving the desired objectives is the possibility of having up-to-date and reliable data, to be able to read, interpret and use in the best way. This is one of the main features of SEOZoom, which among its many features also offers tools that allow you to keep an eye on and anticipate trends and changes in progress, both among SERPs and in the evaluations that Google makes of all ranked sites: let’s talk about the Observatory section and see how it can be useful for our strategies.
What is the SEOZoom Observatory
The Observatory is a specific section of the suite, which provides two different tools basically updated in real time: SERP Observatory is a set of data on the pages of Google search results and on current movements, while instead ZA Observatory is a continuous focus on the distribution of all sites classified according to the Zoom Authority, the original metric of SEOZoom that objectively evaluates the quality of a domain in the eyes of Google.
How and when to use the SERP Observatory
Composed by a summary table and four specific screens, the SERP observatory serves to discover at any time the variability of the first Google pages on all keywords and is ideal for controlling the fluctuations between the results caused, for example, from Google updates (and, in fact, is the tool we use for our analysis of the effects of search engine algorithmic updates).
Moreover, it can be the tool to understand whether the high variability perceived on our pages depends on external factors – updates, in fact, or other overall movements – or whether it is a matter related to our project, and then allows us to have a framework of information to run to cover and resume to have good results.
We can then use the observatory as a reference point for unusual movements among the results positioned on our site, to get an immediate feedback on what is happening at a statistical level on Google UK.
How SEOZoom SERP Observatory works
The observatory shows, at a statistical level, all the fluctuations that there have been in the SERP on Google Italy (and on all other versions of the search engine included in the multilingual database of Seozoom). The understanding of the data is quite simple and intuitive, thanks to the colorful symbols that give at a glance a piece of information about the level of movements.
To be precise, the tool takes as a reference an average trend of fluctuations – that is, results that enter and exit from the first page of Google – and analyzes day by day the level of deviation from this average.
Thus, the red flame symbol in the table and the red dot in the graphs indicate that the data measured by SEOZoom indicates significant activity, with relevant changes within the SERPs; conversely, the moon icon in the table and the light blue dot in the graph are indications of moderate activity, lower than the standard percentage of fluctuations, while finally, the sun icon and the blue dots tell us that results do not deviate from the average.
To make the reading even clearer and quicker, a green coloured band also appears in the graphs of the new suite, which visually identifies the standard average of variations and activity on the SERPs.
In the tabular version, the Observatory offers monitoring of the SERPs of the last week or, by selecting from the appropriate menu, of the last calendar year, and calculates the values of the variations, as mentioned, with respect to the average activity on Google result pages.
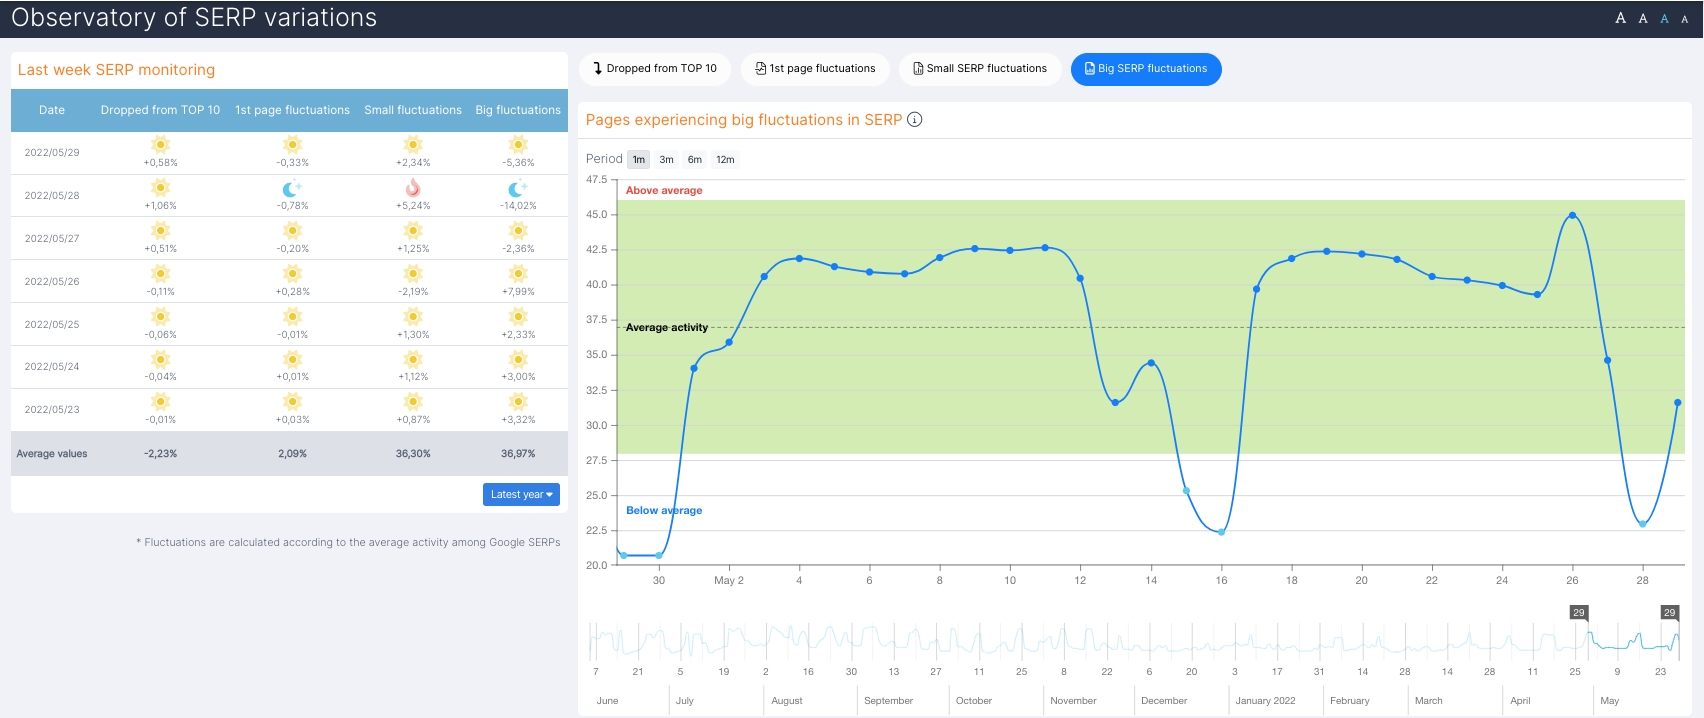
data are divided into 4 categories:
- Dropped from TOP 10: the frequency of variations in the first page of Google results for each keyword, with the alternation between the sites dropping from and those who are now entering in Top10.
- 1st page fluctuations: the frequency between the internal variations on the first Google page, with pages changing position while still remaining in Top10.
- Small fluctuations in SERP: daily analysis of the percentage of web pages that undergo changes in positions of slight magnitude, to identify changes in the current behavior of the Google algorithm.
- Big fluctuations in SERP: analysis of the percentage of web pages undergoing large changes, which can be considered is a continuous quality test on the performance of web pages by Google.
The same data can then also be found in the graphic representations, which extend the monitoring to a month, to have an even wider reference and thus visually discover all the continuous variations of Google.
ZA Observatory, to discover the value scale of sites
The other tool in the section is the Zoom Authority Observatory, which was created to allow everyone to instantly understand the level in which a site ranks according to our metric.
It is a strategic reference both to better understand the context in which our site moves, but also to determine whether the ZA of a domain is good or not, for example in the evaluation phase for link building activities or simple competitor analysis.
How to use the ZA Observatory
Again, we have before us a table and a graph.
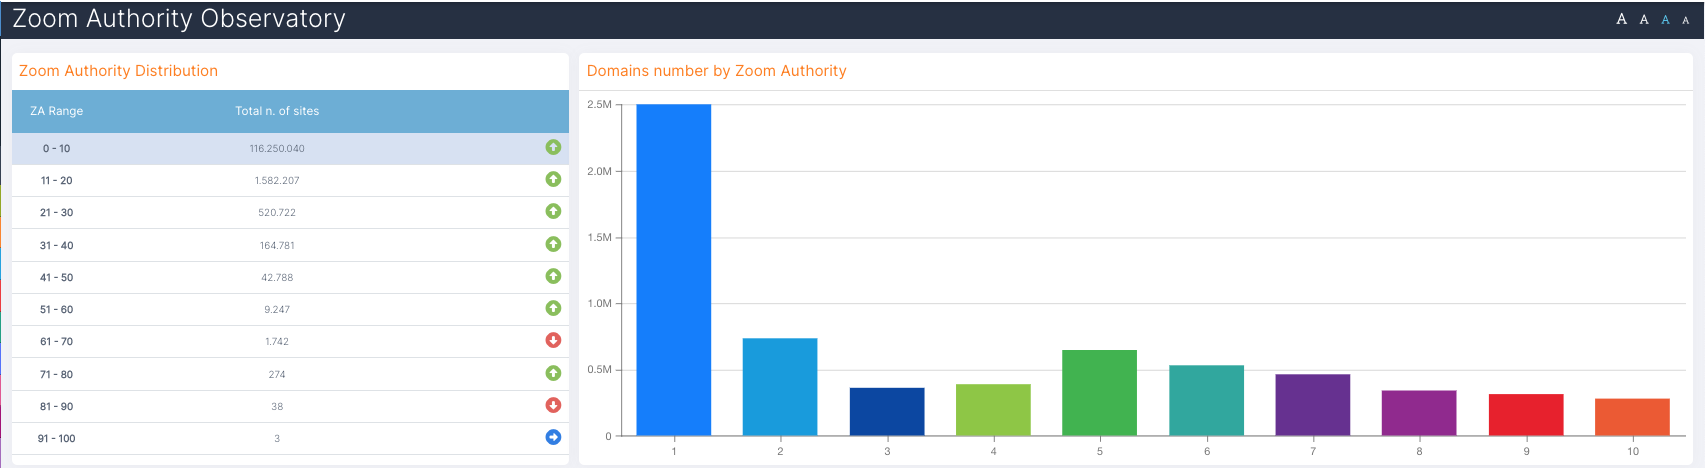
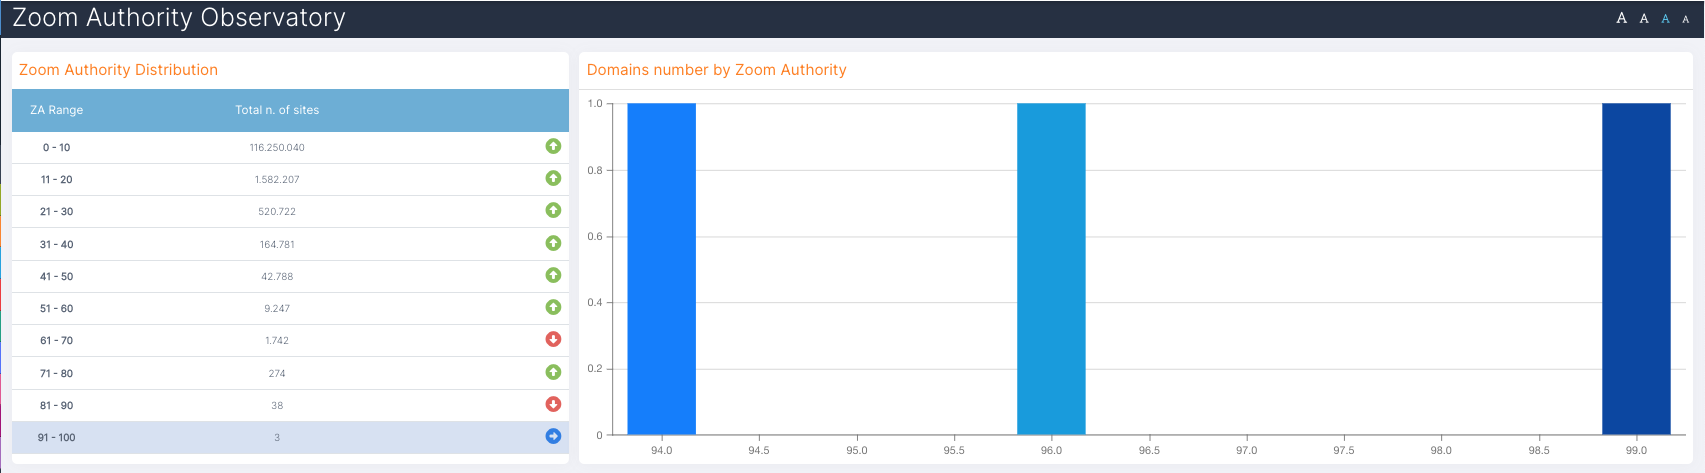
The table lists 10 classes of Zoom Authority values (from 0-10 to 91-100) and immediately indicates the number of sites falling into the range and the quantitative variation compared to the previous monitoring. Moreover, if we click on the single range the graphical display opens, which goes into more detail of the distribution of domains according to the ZA score, showing the full scale.
For instance, in the greater range of ZA from 91-100 there are currently only 3 sites – stable piece of data; the graphic display indicates that, to be precise, in the United Kingdom there is a site that has a ZA value equal to 94, 1 site reaching a score of 96 and the remaining that has a value of 99.
The usefulness of Zoom Authority
As pointed out in other insights, the ZA is a metric that is spreading increasingly for the evaluation of a site, as it is able to offer a reliable enough and useful photograph of the value of each site, looking at key issues such as organic traffic, involvement and growth opportunities.
It is a more “objective” measure and linked to the evaluations themselves of Google (and therefore not to external factors such as number of links or other variables more manipulatable), which makes the ZA also able to adapt and evolve in real time (it is not a value that “expires” or that may suffer algorithmic updates, because it always photographs the current situation).
In summary, then, the Zoom Authority measures how much Google appreciates a site: the higher its value, the more a website is positioned and the better it positions new posts. Therefore, knowing the data of the Zoom Authority of a site allows us to instantly photograph its quality, but it is only by placing it in the right context – the entire Web panorama – that we can really determine its performance.
This is ultimately the purpose of the Zoom Authority observatory, with which we can always have under control the global view of the websites in our database in reference to the Italian market and analyze the authoritativeness of the websites on (and according to) Google UK.