How to monitor Search Console data in Looker Studio
If you can’t measure it, you can’t improve it, said Lord Kelvin; paraphrasing this archaic aphorism, then, if we can measure a parameter we can improve it. And it is precisely this that explains the value and importance of learning to estimate certain key aspects related to our site’s performance – KPIs, but not only – in order to identify possible areas on which to intervene to increase returns and results. Support for this comes today from Google’s Daniel Waisberg, who in the newest episode of the YouTube Google Search Console Training series shares best practices related to monitoring search traffic on websites by integrating GSC data within Looker Studio dashboards.
The dashbord types and purposes of the survey
Before getting into diagrams and charts, Google’s Search Advocate opens a parenthesis to introduce the topic of data visualizations on a higher level (data visualizations on a higher level), which, based on his experience, can be classified into three types of use cases and purposes.
- Monitoring Dashboards
Provides a way to quickly discover a change in data. For example, spikes or dips in page clicks and click-through rates for important pages on a website.
- Data Exploration
Helps uncover information from the data, such as by analyzing search performance patterns in different countries, devices, or sections of the website.
- Data Investigation
Helps discover trends and patterns from aggregated search data. For example, it can be useful to highlight to managers, customers, or the world how a specific industry or topic is performing.

Of course, this information can also be used in an integrated way: for example, the monitoring dashboard allows us to identify a problem, while exploring the data lets us find out what causes it or how to improve performance.
How to use monitoring dashboards
Waisberg focuses particularly on the first type of investigation, and then on monitoring dashboards, which can help us discover problems as they occur. Indeed, by and large, these dashboards are part of most people’s lives: a car dashboard reports key metrics to keep an eye on when we are behind the wheel, and a fitness app allows us to monitor exercise throughout the week.

All monitoring dashboards have one thing in common: they use simple visualizations, such as line or bar charts, that are easy to understand. Their goal is not to make us dive deep into the numbers, because monitoring is about observing the trend and quickly identifying any changes.
What is Looker Studio and how to create monitoring dashboards
The video then gets into the nitty-gritty by introducing Google’s Looker Studio tool, formerly known as Data Studio, which allows you to create customizable charts with just a few clicks, link data from multiple sources, and share results with your team.
Google Data Studio was introduced by Google on March 15, 2016 part of the Google Analytics 360 business suite, and the following year it was released as a free version for individual professionals and small teams.From its inception, it was designed as an online tool to convert data into customizable information reports and shareable dashboards.
More recently, in 2022, Data Studio became Looker Studio, while still retaining its basic features. Specifically, Looker Studio is a free tool that turns data into easy-to-read, easy-to-share, and fully customizable dashboards and information reports, with which you can, among other things:
- Visualize data in extensively customizable charts and tables.
- Easily connect different data sources.
- Share important information with the team or publicly.
- Collaborate with the team on reports.
- Speed up the process of creating reports using built-in sample reports.
Integrate Search Console data into Looker Studio dashboards
The first step in leveraging Google Search Console data as a source to feed Looker Studio reports is to find the monitoring dashboard template, which we will then link to our GSC data source.
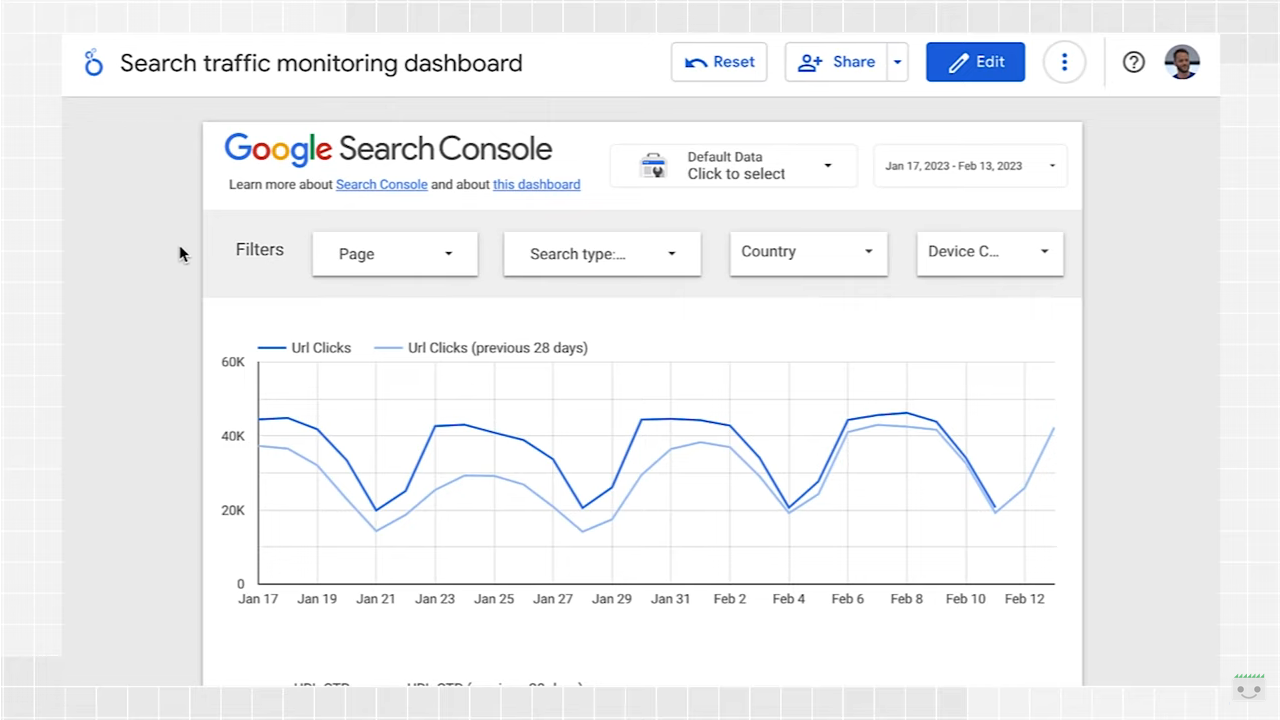
In the example shown by Waisberg, the dashboard has three main sections.
- First are the filters, which allow us to control the data displayed and the dates.
- Second, the line charts, which help us track clicks and CTR over time.
- And last, the table that delves into specific pages.
In the Filters section, we can also switch between the Search Console properties we have access to.
We can set the view by selecting a date range or one of the following options:
- Page
This is used to include or exclude one or more pages on our website. We can use regular expressions – regex – similarly to what we do in Search Console.
- Type
Allows a choice of data types, including Discover and Google News, with the option to set only one type at a time, however.
- Country
Allows you to include or exclude one or more countries/nations.
- Device
To choose one or more categories of devices to be tracked.
After filtering the data, line graphs will show how the metrics change over time. Waisber chose to look at clicks and click-through rate or CTR, and at a glance we immediately see that in the case at hand, weekend and weekday data have very different patterns.
It is a good practice, says the Googler, to always use a multiple of seven days in line graphs, paying particular attention to the days that come out of the pattern.
Charts are very useful in analyzing trends, but if we want to investigate further, it is more effective to analyze particular pages or groups using a table.
For example, we can use the page filter to include only specific sections of the website, the Country filter to check the performance of different pages in geographic areas that are relevant to the business, the type filter to analyze page-level performance for each of the data types.
Still, Looker Studio provides the data blending feature, which basically allows other data sources, such as website sections, country/regions, and budgets, to be added to the dashboard, thus creating charts, tables, and controls based on multiple data sources.
Adding other data sources to Looker Studio
From a practical point of view, if we have a spreadsheet that maps all the pages to different sections of the website, we can load it into Looker Studio by creating a data source; the second step is to go to the search traffic monitoring dashboard and select the table.
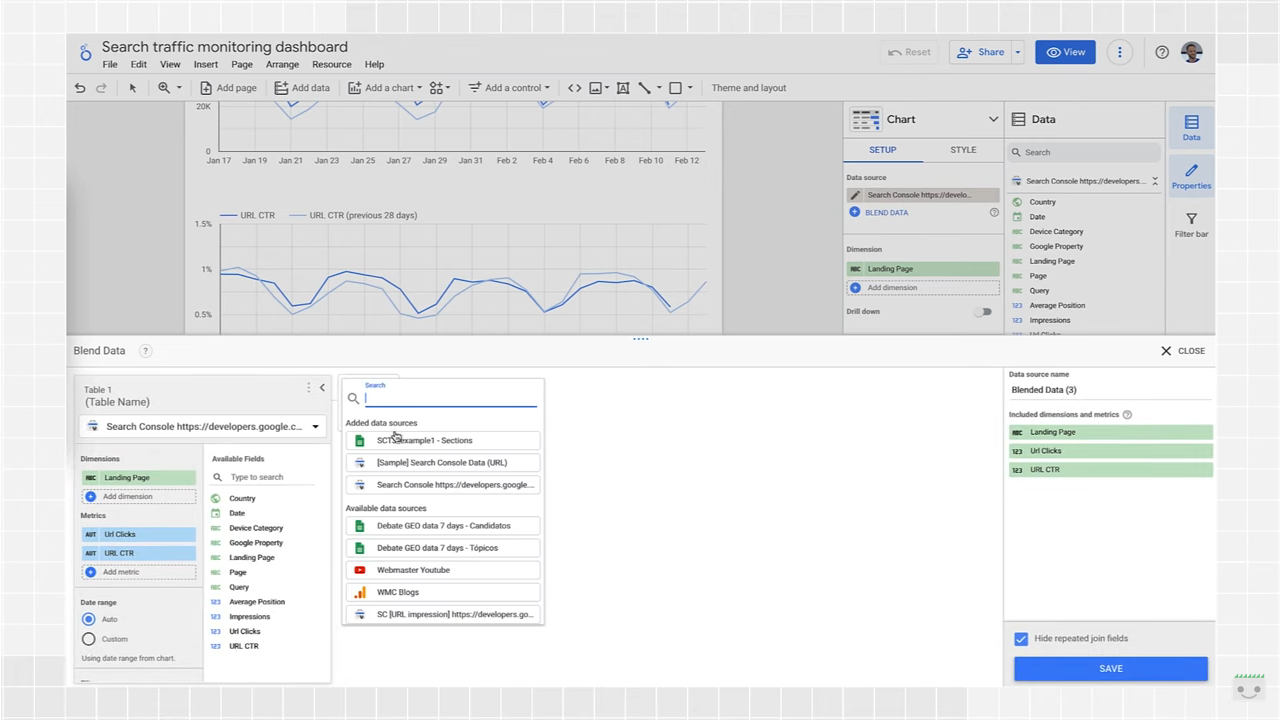
In the configuration menu, we will find at this point an option to join the data, with an interface that allows us to join the table to the data source we have loaded-with various possibilities for performing this join. In particular, Looker Studio supports the following join operators:
- Inner join: returns only the matching rows from the left and right tables.
- Left outer join: returns matching rows from the right table, plus non-matching rows from the left tables.
- Right outer join: returns matching rows from the left tables, plus non-matching rows from the right table.
- Full outer join: returns all matching rows from the left or right tables.
- Cross join: returns every possible combination of rows from the left and right tables.
In the video, Waisberg selects left outer join, which precisely returns matching rows from the right table plus non-matching rows from the left table. Continuing with the technical settings (enter the Section dimension in the appropriate box to make it available in the table configuration), we can then monitor key metrics by section on an ongoing basis.
We can do the same for multiple tables, so we can enrich the monitoring dashboards with information not available through Search Console.
In addition to page groups, we can also join clusters of queues, countries/regions, and others, because “the only limit is your imagination.”